# inline/factors-1.yml

WT:
  short: weight
FORM:
  short: formulation
  values: [3, 2, 1]
decode: [tablet, capsule, troche]yspec lets you turn discrete data items into factors with nicely-formed names using the ys_factors() function. This is my most-used function in the yspec workflow so I wanted to make a separate page to highlight this functionality.
7.1 Example spec
Here’s a very simple example of a data specification file with two variables, WT and FORM
FORM is formulation, a discrete data item. The values in the data set are either 1, 2, or 3 and these decode to troche, capsule and tablet, respectively.
We can confirm the coding after reading this into our R session
spec <- ys_load("inline/factors-1.yml")
spec$FORM
name value
col FORM
type numeric
short formulation
value 3 : tablet
2 : capsule
1 : troche 7.2 Example data
We also have a data set that goes along with this data specification object
7.3 Add factors to a data set
Working with this data set, I’d like to be able to see the decodes that I specified for FORM in addition to the numbers. We can use the spec object to add the factors to the data frame using ys_factors()
data <- ys_factors(data, spec)Now, FORM is a factor and we have one additional column, FORM_v which is the original value of FORM
head(data) WT FORM FORM_v
1 61.1 troche 1
2 50.3 tablet 3
3 80.2 capsule 2
4 91.8 troche 1
5 70.0 troche 1count(data, FORM, FORM_v) FORM FORM_v n
1 tablet 3 1
2 capsule 2 1
3 troche 1 37.4 Looking for factors
Here, yspec looked through the spec object for data items that could be turned into a factor. It found FORM because FORM had the values field populated (we listed every possible value for FORM there). yspec turned that into a factor and saved out the original value with the _v suffix.
7.5 Factor ordering
Notice that we coded FORM to be 3, 2 or 1, in that order. When ys_factors() turns FORM into a factor, it respects the order in which you added when creating the factor. This is is very important when you need to gain control over, for examples, the order in which you want data to appear in plots or tables
library(ggplot2)

ggplot(data = data, aes(x = FORM)) + geom_bar() +theme_bw()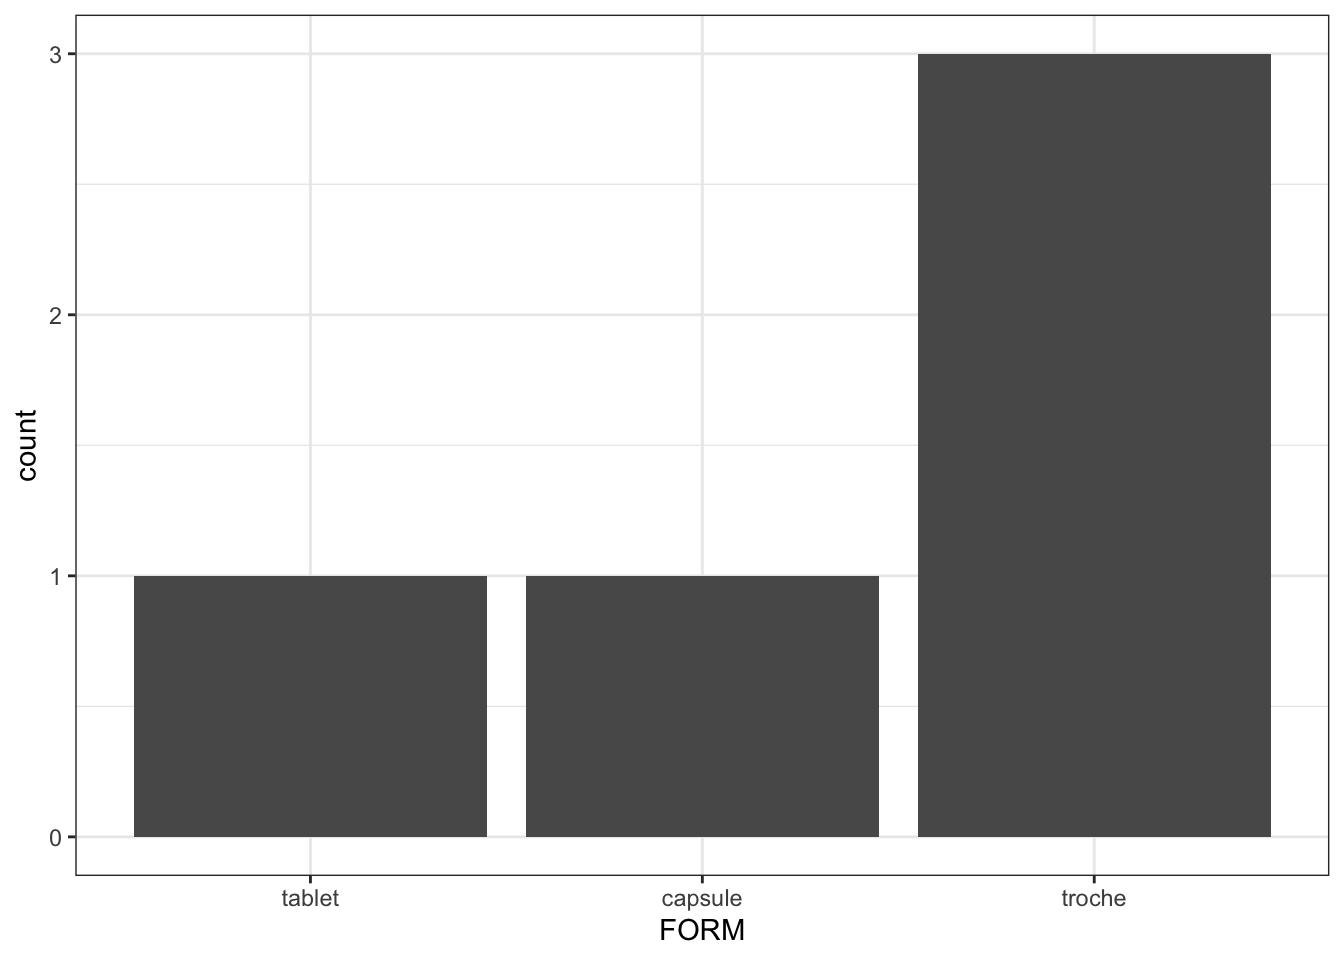
7.6 Forcing factors
Any column that yspec finds to have the values filled in can / will be turned into a factor. You can also force the data item to be turned into a factor by using the make_factor field. For example
# inline/factors-2.yml

foo:
  short: just for illustration
  make_factor: true
spec <- ys_load("inline/factors-2.yml")From this data set
  foo
1  11
2  99
3 120
4   5
we can also add factors even though the values field was not populated
data <- ys_add_factors(data, spec)str(data)'data.frame': 4 obs. of 2 variables:
$ foo : num 11 99 120 5
$ foo_f: Factor w/ 4 levels "5","11","99",..: 2 3 4 17.7 Selectively adding factors
By default, yspec will add every factor that it can find. You can override this behavior by specifying the columns that you want processed to factors.
This example yspec file and data set come with yspec
# ?ys_help
data <- ys_help$data()
spec <- ys_help$spec()
We can pull just the discrete columns
ys_filter(spec, discrete) name info unit short source
C cd- . comment character ysdb_internal
SEQ -d- . SEQ .
EVID -d- . event ID ysdb_internal
CP -d- . Child-Pugh score look
MDV -d- . MDV ysdb_internal
BLQ -d- . below limit of quantification .
PHASE --- . study phase indicator .
STUDY -d- . study number .
RF cd- . renal function stage . Let’s only make factors for EVID and BLQ
data <- ys_factors(data, spec, EVID, BLQ)

head(data, n = 3)
C NUM ID SUBJ TIME SEQ CMT EVID AMT DV AGE WT CRCL ALB
1 NA 1 1 1 0.00 0 1 dose 5 0.000 28.03 55.16 114.45 4.4
2 NA 2 1 1 0.61 1 2 observation NA 61.005 28.03 55.16 114.45 4.4
3 NA 3 1 1 1.15 1 2 observation NA 90.976 28.03 55.16 114.45 4.4
BMI AAG SCR AST ALT HT CP TAFD TAD LDOS MDV BLQ PHASE
1 21.67 106.36 1.14 11.88 12.66 159.55 0 0.00 0.00 5 1 above QL 1
2 21.67 106.36 1.14 11.88 12.66 159.55 0 0.61 0.61 5 0 above QL 1
3 21.67 106.36 1.14 11.88 12.66 159.55 0 1.15 1.15 5 0 above QL 1
STUDY RF EVID_v BLQ_v
1 1 norm 1 0
2 1 norm 0 0
3 1 norm 0 07.8 Alternative interface
If you want to retain data columns as the are in the data but add the factors as new columns, you can use ys_add_factors(). For example
ys_add_factors(data, spec) WT FORM FORM_f
1 61.1 1 troche
2 50.3 3 tablet
3 80.2 2 capsule
4 91.8 1 troche
5 70.0 1 trocheThis did essentially the same thing as ys_factors() … we have both factor and value versions of FORM in the data set, but now the factor has this _f suffix (FORM_f) and the values are still under FORM.
Prior to ys_factors() we always used ys_add_factors(), but frequently wanted the original variable name to be the factor version. So either function will get you the factor, but we think ys_factors() is closer to what we want most of the time.