Introduction
This vignette takes the user through some basic scenarios for
defining, formatting, and making parameter tables using
pmparams. For more information how to effectively integrate
pmparams into your workflow, visit the
MeRGE Expo: Parameter Tables .
Data requirements
Parameter key
We begin by creating a parameter key that tells R how to interpret you parameter values. Our code require four arguments for each parameter:
- abb - abbreviation for model parameter (we use latex coding)
- desc - parameter description to appear
- panel - the table panel the parameter should appear under
- trans - definition of how the parameter should be transformed
If you have a model that uses theta in the $ERROR block, make sure
that the theta section’s panel is “RV” so that pmparams
functions can properly identify it.
It is recommended to use a parameter key yaml, but
pmparams works for parameter key tibbles.
A more detailed walk-through of generating the parameter key is available here: MeRGE Expo: Creating a Parameter Key .
model_dir <- system.file("model/nonmem", package = "pmparams")
paramKey <- file.path(model_dir, "pk-parameter-key-new.yaml")

yaml::yaml.load_file(paramKey) %>% unlist() %>% head()
#>                             THETA1.abb                            THETA1.desc
#>                             "KA (1/h)" "First order absorption rate constant"
#>                           THETA1.panel                           THETA1.trans
#>                               "struct"                             "logTrans"
#>                             THETA2.abb                            THETA2.desc
#>                             "V2/F (L)"              "Apparent central volume"
Parameter estimates
pmparams allows for different parameter estimate input
types:
- path to a
bbrNONMEM model -
bbrNONMEM model (output frombbr::read_model()) -
bbrNONMEM model summary (output frombbr::model_summary()) - data.frame of parameter estimates (e.g., output from
bbr::param_estimates())
For this example, we will use a bbr model
mod <- bbr::read_model(file.path(model_dir, "102"))Define parameter table
We will now join parameter estimates and parameter key. Note: this is
an inner_join, so only parameters included in the model
output and parameter key will be kept in the table. This was done so
that, if your base and final model used the same structural THETAs and
random parameters, the same parameter key could be used for both. The
additional covariate THETAs defined in the parameter key YAML would
simply be ignored when creating the base model parameter table.
Additionally, define_param_table performs checks and
calculates confidence intervals.
param_df <- mod %>%
  define_param_table(.key = paramKey)

head(param_df)
#> # A tibble: 6 × 33
#>   parameter_names estimate stderr random_effect_sd random_effect_sdse fixed
#>   <chr>              <dbl>  <dbl>            <dbl>              <dbl> <lgl>
#> 1 THETA1             0.434 0.0629           NA                NA      FALSE
#> 2 THETA2             4.12  0.0276           NA                NA      FALSE
#> 3 THETA3             1.12  0.0328           NA                NA      FALSE
#> 4 THETA4             4.21  0.0192           NA                NA      FALSE
#> 5 THETA5             1.29  0.0354           NA                NA      FALSE
#> 6 OMEGA(1,1)         0.221 0.0530            0.470             0.0564 FALSE
#> # ℹ 27 more variables: diag <lgl>, shrinkage <dbl>, name <chr>, abb <chr>,
#> #   desc <chr>, panel <chr>, trans <chr>, nrow <int>, transTHETA <lgl>,
#> #   THETAERR <lgl>, TH <lgl>, OM <lgl>, S <lgl>, LOG <lgl>, LOGIT <lgl>,
#> #   lognormO <lgl>, Osd <lgl>, logitOsd <lgl>, propErr <lgl>, addErr <lgl>,
#> #   addErrLogDV <lgl>, value <dbl>, se <dbl>, corr_SD <dbl>, lower <dbl>,
#> #   upper <dbl>, ci_level <dbl>
Format parameter table
Now, we perform some house-keeping based on the new parameter key
information, calculate any summary statistics (the 95% confidence
intervals are calculated by default), and format the values for the
report using format_param_table().
param_df <- param_df %>%
  format_param_table(.cleanup_cols = TRUE, .digit = 3)

head(param_df)
#> # A tibble: 6 × 7
#>   type                                abb      greek desc  value ci_95 shrinkage
#>   <chr>                               <chr>    <glu> <chr> <glu> <chr> <chr>
#> 1 Structural model parameters         KA (1/h) $\ex… Firs… 1.54  1.36… -
#> 2 Structural model parameters         V2/F (L) $\ex… Appa… 61.5  58.2… -
#> 3 Structural model parameters         CL/F (L… $\ex… Appa… 3.05  2.86… -
#> 4 Structural model parameters         V3/F (L) $\ex… Appa… 67.4  64.9… -
#> 5 Structural model parameters         Q/F (L/… $\ex… Appa… 3.62  3.38… -
#> 6 Interindividual variance parameters IIV-KA   $\Om… Vari… 0.22… 0.11… 18.2
Usually define_param_table and
format_param_table are run together in a single call like
this:
param_df <- define_param_table(
  .estimates = paramEstimatePath,
  .key = paramKeyPath
) %>% format_param_table()
Make parameter table
We can leverage make_pmtable() to generate fixed effects
and random effects parameter tables, and param_notes() to
easily add informative footnotes or notes.
# grab footnotes
footnote <- param_notes(.ci = 95)
##  FIXED EFFECTS table ----------------------------
tab_fixed <- make_pmtable(param_df, .pmtype = "fixed") %>%
  # abbreviations
  st_notes(footnote$ci, footnote$se) %>%
  st_notes_str() %>%
  # equations
  st_notes(footnote$ciEq) %>%
  # file
  st_files(output = "deliv/final-param-fixed-ci-95.tex")

tab_fixed_out <- tab_fixed %>% stable() %>%
  stable_save_image(format = "png")
st_image_show(tab_fixed_out, width = 0.6)
##  RANDOM EFFECTS table ----------------------------
tab_random <- make_pmtable(param_df, .pmtype = "random") %>%
  # abbreviations
  st_notes(footnote$ci, footnote$se) %>%
  st_notes_str() %>%
  # equations
  st_notes(footnote$cvOmegaEq, footnote$cvSigmaEq) %>%
  # file
  st_files(output = "deliv/final-param-random-ci-95.tex")

tab_random_out <- tab_random %>% stable() %>%
  stable_save_image(format = "png")
st_image_show(tab_random_out, width = 0.6)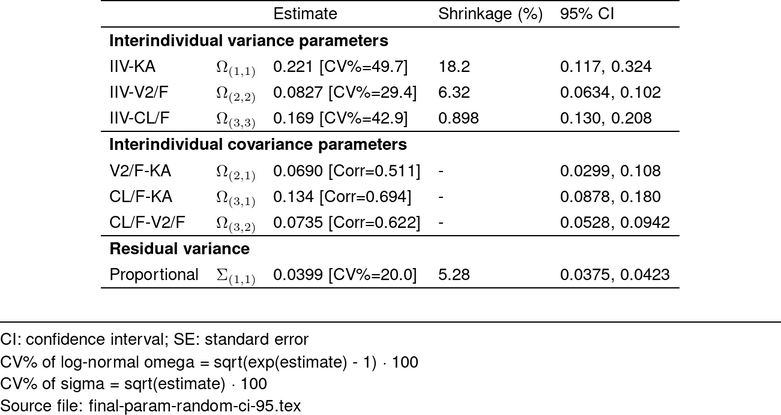
If you want to add or overwrite pre-defined pmtables
argument, simply pipe onto the make_pmtable tibble:
tab_random2 <- tab_random %>%
  st_panel("abb") %>%
  st_select(-"type", -"greek") %>%
  st_files(output = "deliv/final-param-random-ci-95-modified.tex")

tab_random_out2 <- tab_random2 %>% stable() %>%
  stable_save_image(format = "png")
st_image_show(tab_random_out2, width = 0.6)
Other functions
pmparams exports two functions for appending bootstrap
estimates to parameter tables. See the
Reference Log for more details.