This function relabels x and y axis titles based on the data columns
used to create the plot, looking up in a named list or yspec object. This
is only for pmplot outputs; consider pm_relabel() for labeling
aesthetics in an arbitrary gg object.
Arguments
- obj
a gg object created through a
pmplotsfunction, apatchworkobject (e.g., frometa_covariate()ornpde_panel()), or a list of such objects.- ...
additional arguments passed to
pmp_gg_labs().- spec
a named list of label data; names correspond to columns in the data used to make the plot; may also be a
yspecobject, which will be converted to a named list throughyspec::ys_get_short_unit().- labs
another object like
speccontaining of label data to override names found inspec.
Details
Methods are provided for gg objects (single pmplots plots), patchwork
objects (multi-panel layouts produced by functions such as eta_covariate()
or npde_panel()), and plain list objects containing pmplots plots.
The patchwork method applies the relabeling to every panel in the layout
using the & operator.
See also
Examples
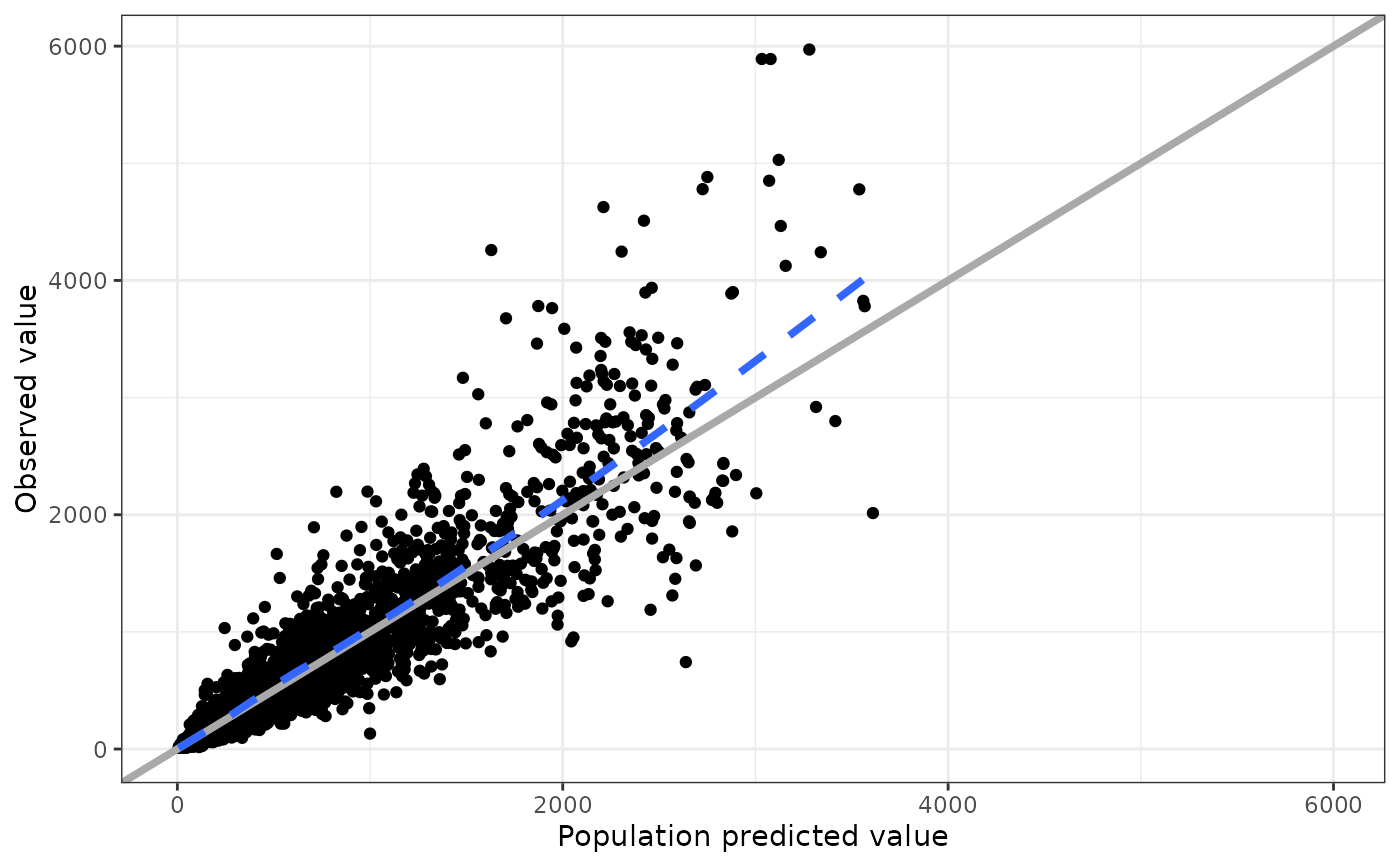
data <- pmplots_data_obs()
p <- dv_pred(data)
p
#> `geom_smooth()` using formula = 'y ~ x'
 spec <- list(DV = "CX1123 concentration (ng/mL)")
if (FALSE) { # \dontrun{
p <- pmp_relabel(p, spec)
p
} # }
spec <- list(DV = "CX1123 concentration (ng/mL)")
if (FALSE) { # \dontrun{
p <- pmp_relabel(p, spec)
p
} # }