# A tibble: 6 × 9
  STUDY       DOSE   FORM    N     WT    CRCL  AGE   ALB   SCR
  <chr>       <chr>  <chr>   <chr> <chr> <chr> <chr> <chr> <chr>
1 12-DEMO-001 100 mg tablet  80    71.4  104   33.7  4.20  1.06
2 12-DEMO-001 150 mg capsule 16    89.4  122   24.4  4.63  1.12
3 12-DEMO-001 150 mg tablet  48    81.7  104   34.4  3.83  0.910
4 12-DEMO-001 150 mg troche  16    94.0  93.2  27.4  4.94  1.25
5 12-DEMO-001 200 mg tablet  64    67.9  100   27.5  4.25  1.10
6 12-DEMO-001 200 mg troche 16 76.6 99.2 22.8 4.54 1.15 6.1 Basics
Mostly working with this data; but some others come in later to illustrate certain features.
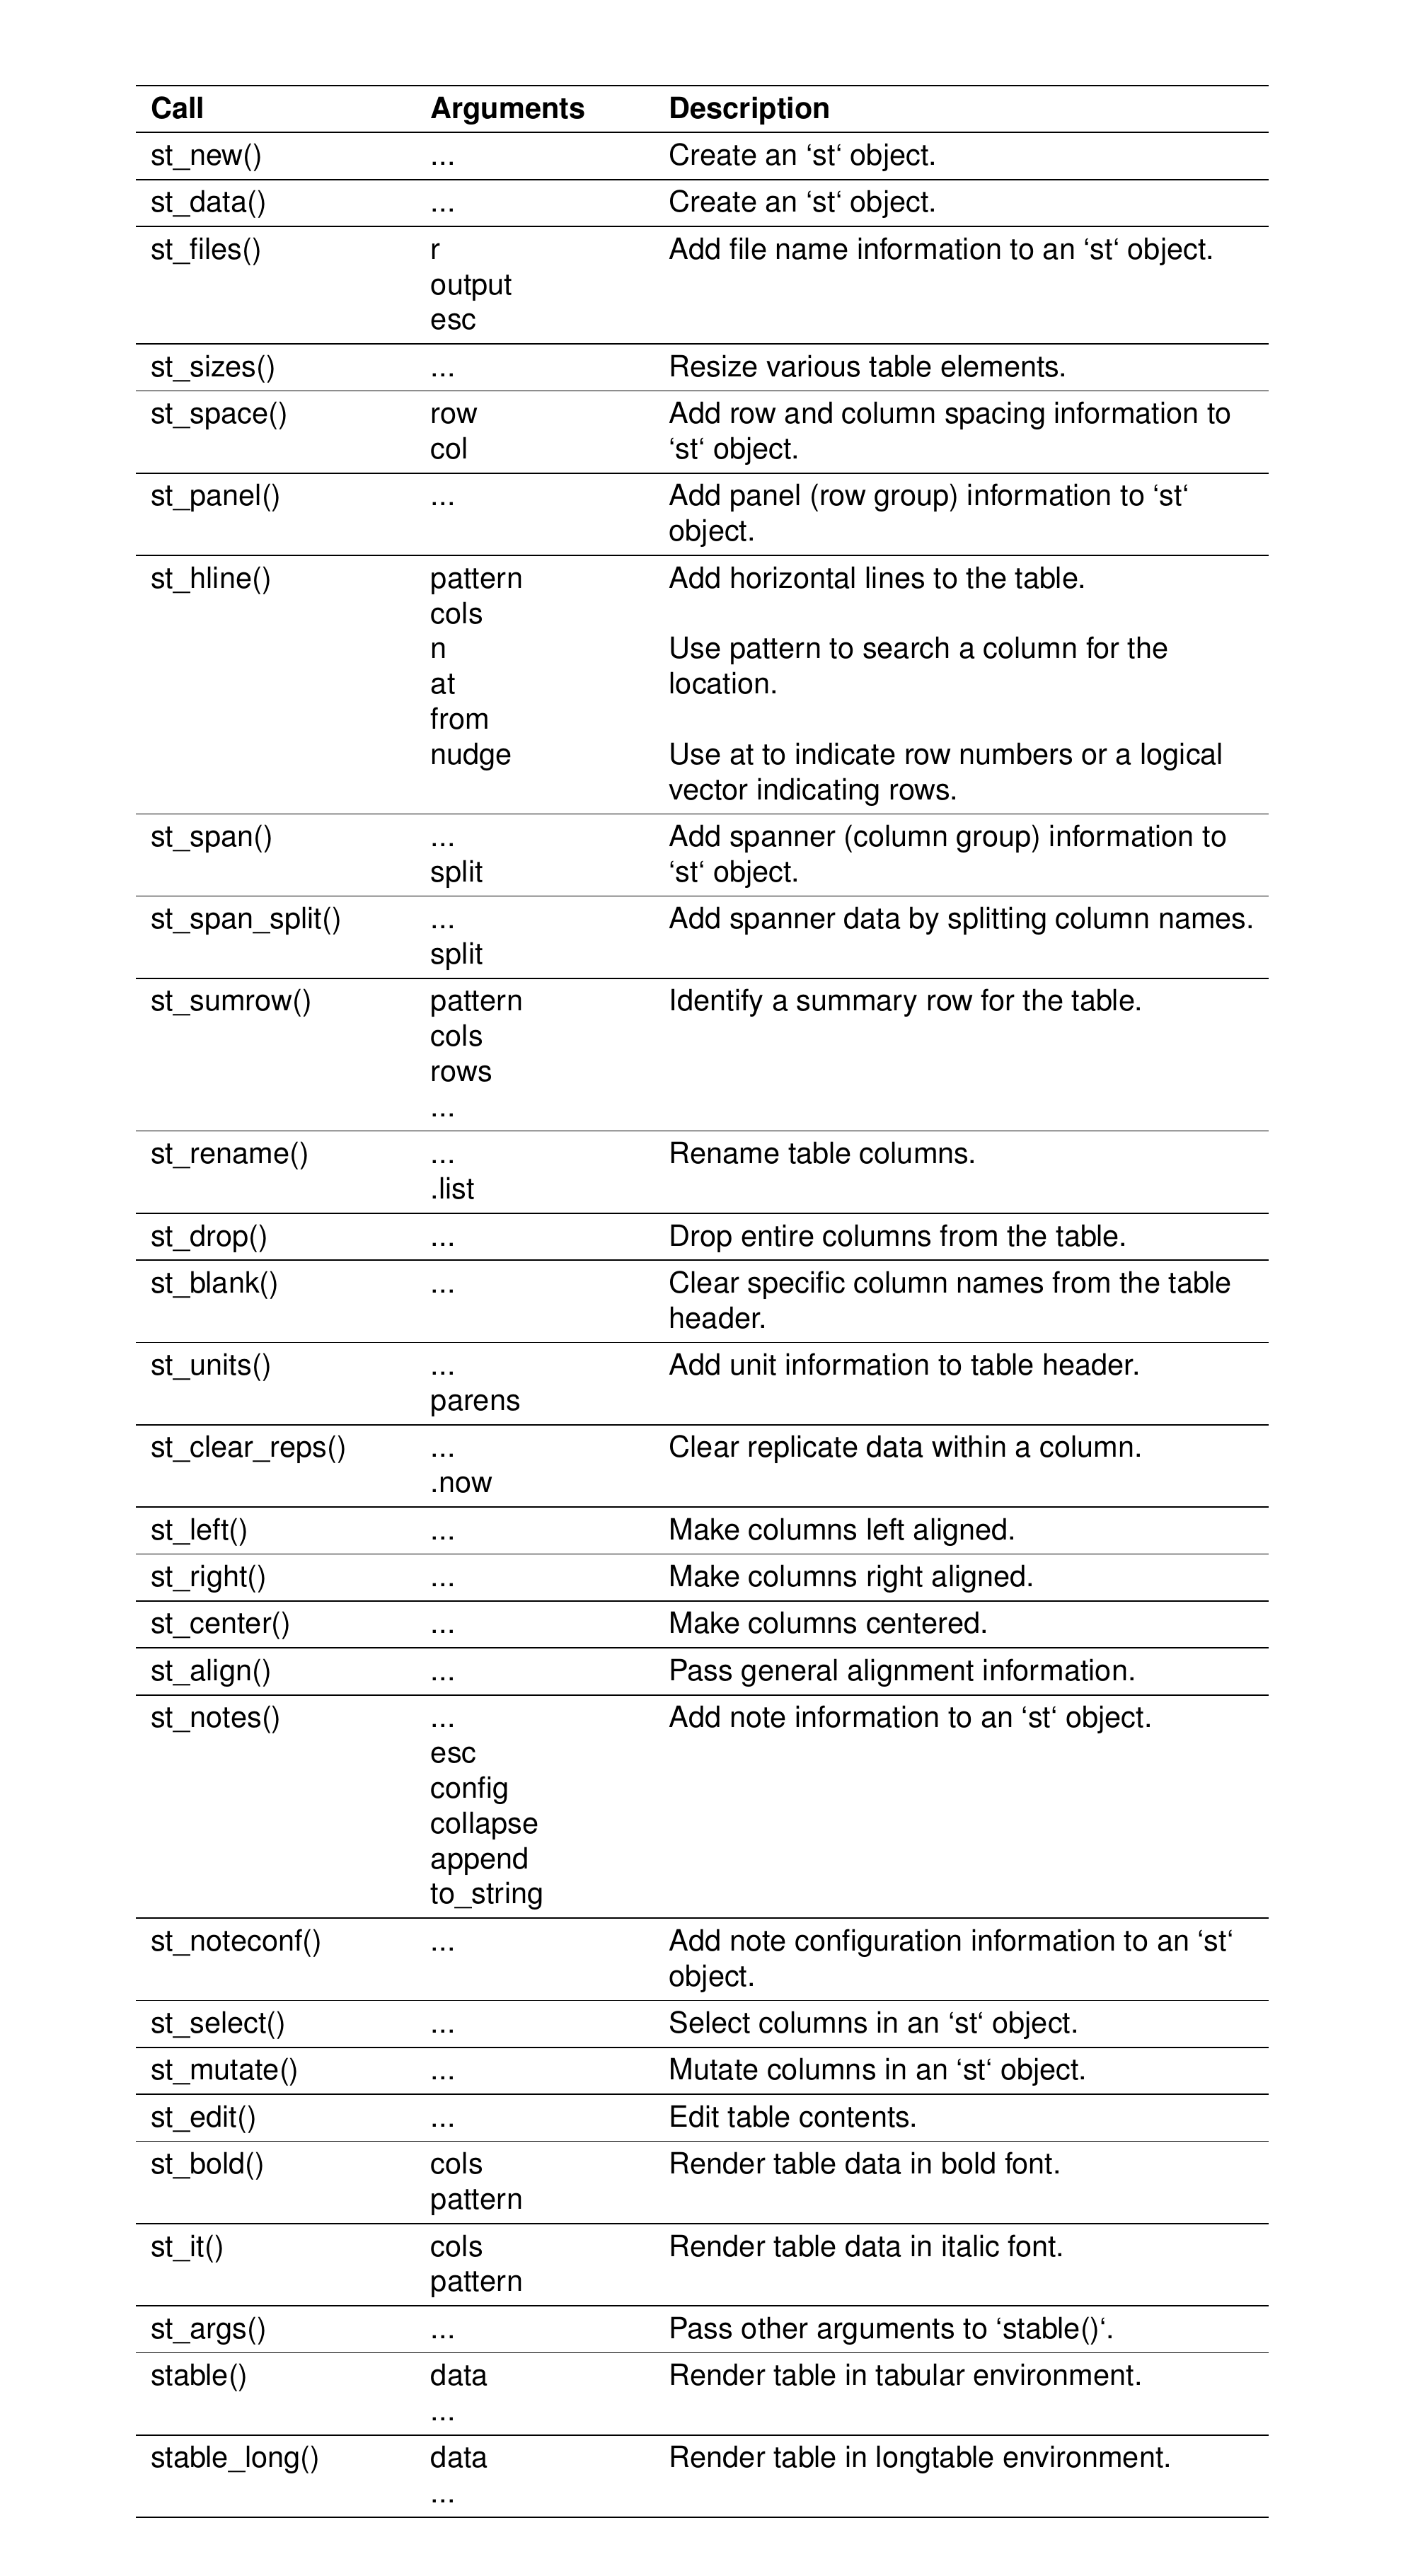
You start out a pipeline by passing your data frame into st_new()
This creates an object that gets revised by subsequent steps in the pipeline, adding features and styling as you go.
For the final step in the pipeline, we’ll send the object to stable() to create the table
[1] "\\setlength{\\tabcolsep}{5pt} "
[2] "\\begin{threeparttable}"
[3] "\\renewcommand{\\arraystretch}{1.3}"
[4] "\\begin{tabular}[h]{lllllllll}"
[5] "\\hline"
[6] "STUDY & DOSE & FORM & N & WT & CRCL & AGE & ALB & SCR \\\\"
[7] "\\hline"
[8] "12-DEMO-001 & 100 mg & tablet & 80 & 71.4 & 104 & 33.7 & 4.20 & 1.06 \\\\"
[9] "12-DEMO-001 & 150 mg & capsule & 16 & 89.4 & 122 & 24.4 & 4.63 & 1.12 \\\\"
6.2 Simple table
You can terminate the pipeline and create a tabular table by sending to stable()
Equivalent call
6.3 Long table
You can also pipe to stable_long() to make a long table
6.4 Annotate with file names
Equivalent call
Note that in the pipe version, we already have file in the function name so that gets dropped from the argument name.
6.5 Save a table
First convert with stable() or stable_long() then save with stable_save()
6.6 Align columns
st_center(...)st_left(...)st_right(...)st_align(...)
Equivalent call
6.7 Fix a column width
This is an aspect of aligning columns and uses col_ragged() most of the time. For example, if we want columns left-justified but the Title column is to be capped at 5 cm
6.8 Rename columns
Equivalent call
6.9 Blank columns
Equivalent call
6.10 Drop columns
Equivalent call
6.11 Notes
- Multiple calls are allowed; notes will accumulate
Equivalent call
6.12 Units
Note that st_units() will automatically add parens to your units; this can be suppressed with the parens argument.
Units can also be added as a list
Equivalent call
6.13 panel
Equivalent call
6.14 span
Equivalent call
6.15 hlines - at
To put horizontal lines at specific rows
Equivalent call
6.16 hlines - from
To calculate hlines based on data frame column values (for example, to break the table by changing values of STUDYf)
Equivalent call
6.17 hlines - pattern
To search the table for a pattern and add hlines above matches
The cols argument limits the search to the Summary column; omit this argument to search the whole table.
There is no equivalent call for this using straight stable().
6.18 Clear replicate values
To create groups by “clearing” replicate values in a column
Equivalent call
7 Row and column padding
Use st_sizes() to change padding in rows or columns or adjust other aspects of table sizes
Equivalent call
 [1] "\\setlength{\\tabcolsep}{6pt} "
 [2] "\\begin{threeparttable}"
 [3] "\\renewcommand{\\arraystretch}{1.1}"
 [4] "\\begin{tabular}[h]{lllllllll}"
 [5] "\\hline"
 [6] "STUDY & DOSE & FORM & N & WT & CRCL & AGE & ALB & SCR \\\\"
 [7] "\\hline"
 [8] "12-DEMO-001 & 100 mg & tablet & 80 & 71.4 & 104 & 33.7 & 4.20 & 1.06 \\\\"
 [9] "12-DEMO-001 & 150 mg & capsule & 16 & 89.4 & 122 & 24.4 & 4.63 & 1.12 \\\\"
[10] "12-DEMO-001 & 150 mg & tablet & 48 & 81.7 & 104 & 34.4 & 3.83 & 0.910 \\\\"
[11] "12-DEMO-001 & 150 mg & troche & 16 & 94.0 & 93.2 & 27.4 & 4.94 & 1.25 \\\\"
[12] "12-DEMO-001 & 200 mg & tablet & 64 & 67.9 & 100 & 27.5 & 4.25 & 1.10 \\\\"
[13] "12-DEMO-001 & 200 mg & troche & 16 & 76.6 & 99.2 & 22.8 & 4.54 & 1.15 \\\\"
[14] "12-DEMO-002 & 100 mg & capsule & 36 & 61.3 & 113 & 38.3 & 4.04 & 1.28 \\\\"
[15] "12-DEMO-002 & 100 mg & tablet & 324 & 77.6 & 106 & 29.9 & 4.31 & 0.981 \\\\"
[16] "12-DEMO-002 & 50 mg & capsule & 36 & 74.1 & 112 & 37.1 & 4.44 & 0.900 \\\\"
[17] "12-DEMO-002 & 50 mg & tablet & 324 & 71.2 & 106 & 34.1 & 4.63 & 0.868 \\\\"
[18] "12-DEMO-002 & 75 mg & capsule & 36 & 72.4 & 105 & 38.2 & 3.89 & 0.900 \\\\"
[19] "12-DEMO-002 & 75 mg & tablet & 288 & 71.6 & 98.9 & 34.2 & 4.49 & 0.991 \\\\"
[20] "12-DEMO-002 & 75 mg & troche & 36 & 73.6 & 103 & 49.2 & 4.52 & 0.930 \\\\"
[21] "\\hline"
[22] "\\end{tabular}"
[23] "\\end{threeparttable}"
attr(,"class")
[1] "stable"
The arguments to st_sizes() get passed to tab_size().
8 Pipe cheat table