pm_box(id, x = "STUDYc", y = "WT")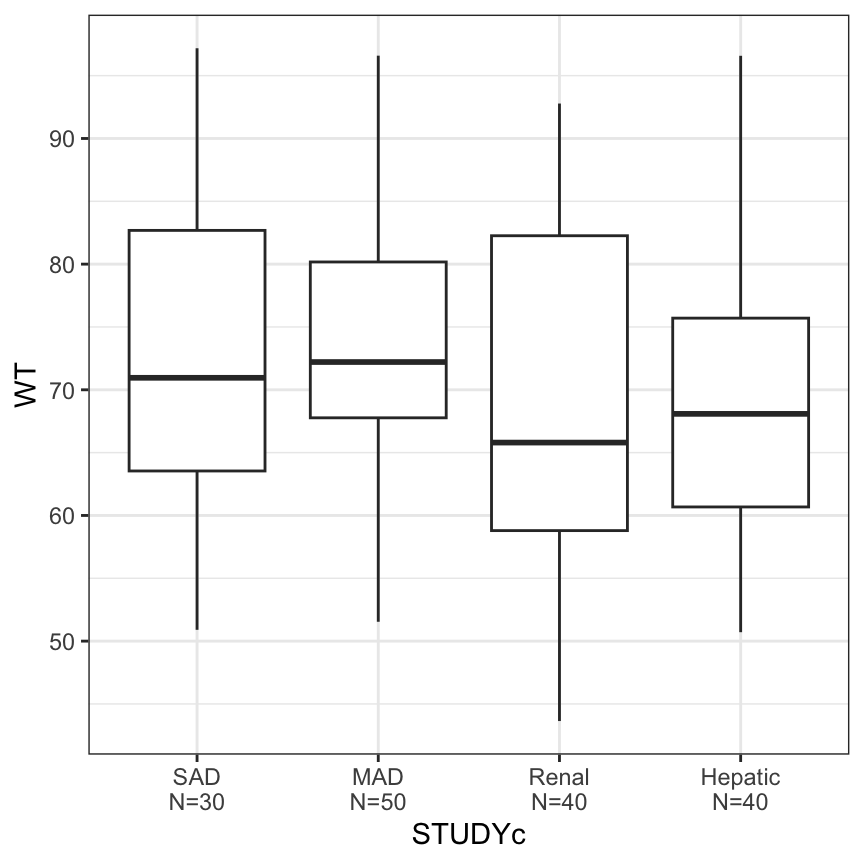
[pm_box]pm_box(id, x = "STUDYc", y = "WT")
This is also called cont_cat().
covs <- c("WT", "AGE", "ALB")

pm_box(id, x = "STUDYc", y = covs) %>%
  pm_grid(ncol = 3)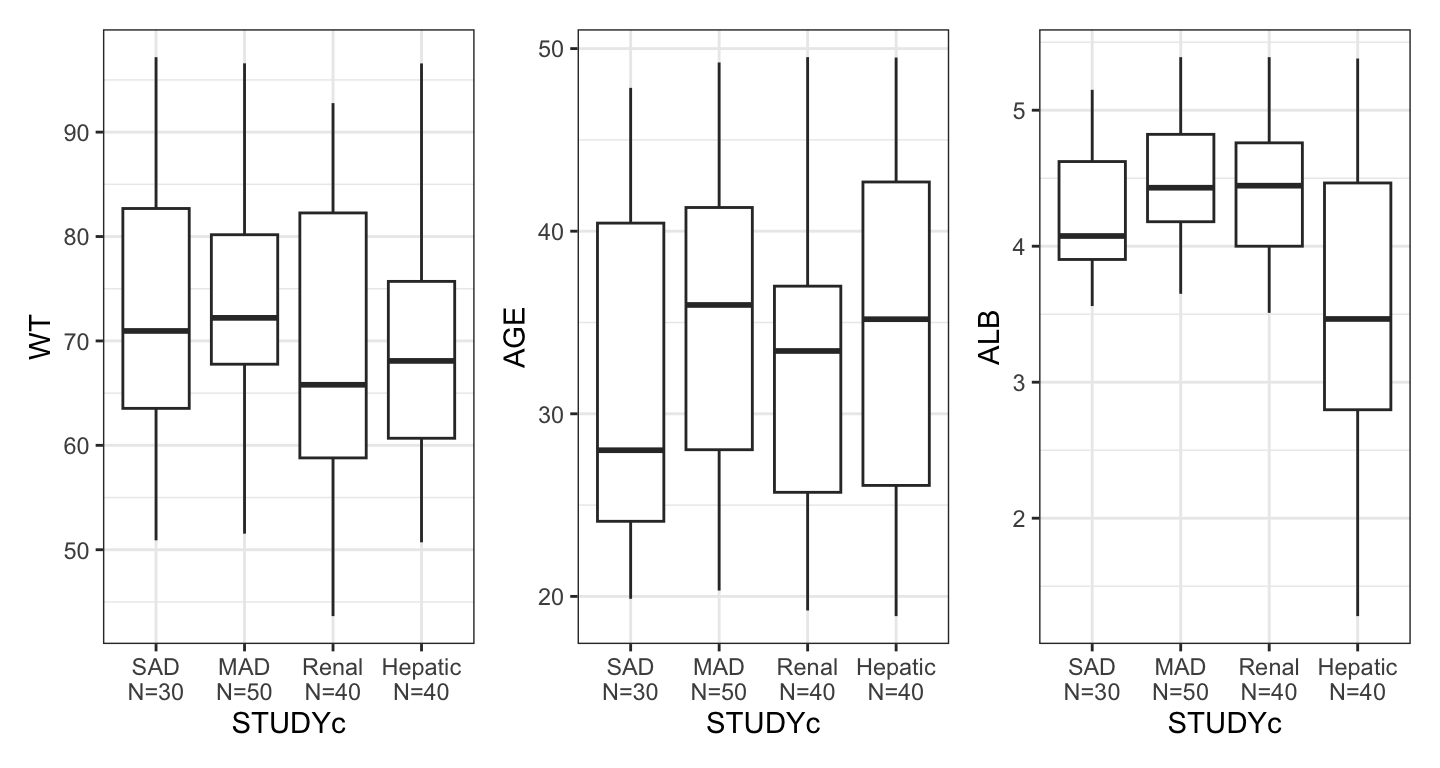
[pm_scatter]pm_scatter(id, x = "WT", y = "CRCL")
This is also called cont_cont().
covs <- c("SCR", "AGE", "ALB")

pm_scatter(id, x = "WT", y = covs) %>%
  pm_grid(ncol = 3)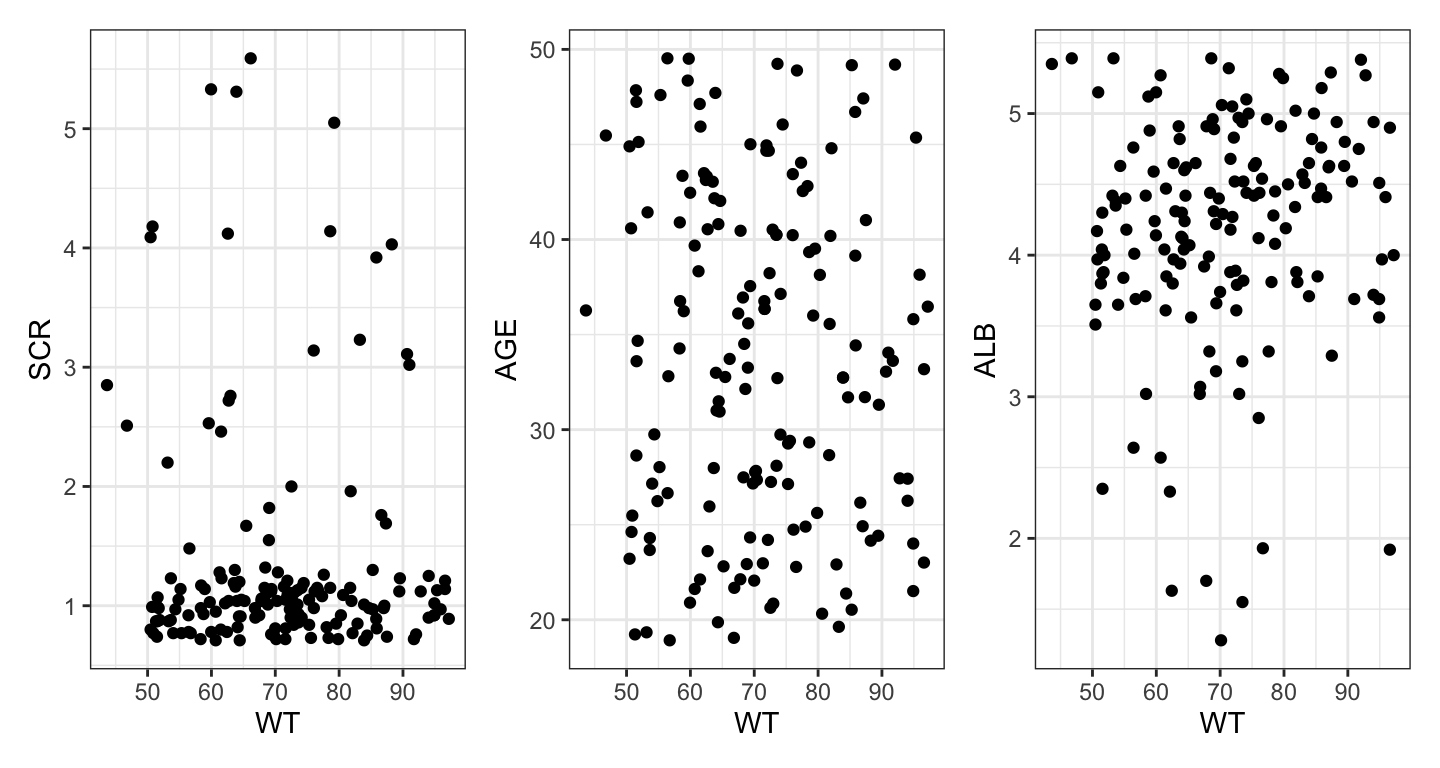
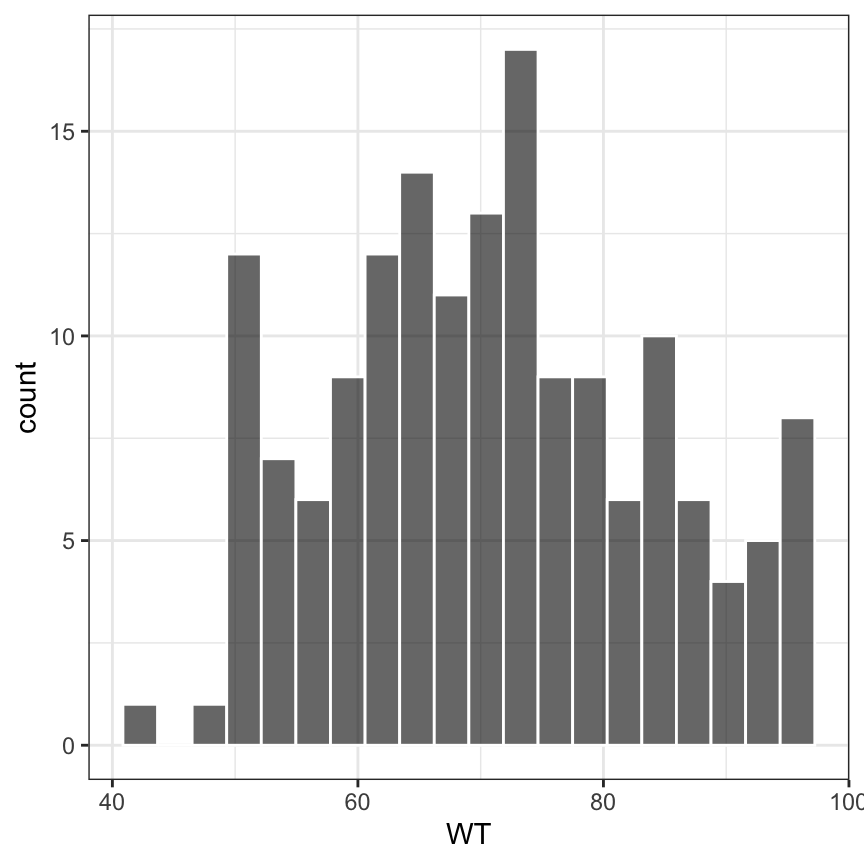
[cont_hist]cont_hist(id, x = "WT", bins = 20)