data <- pmplots_data_obs()

npde_panel(data)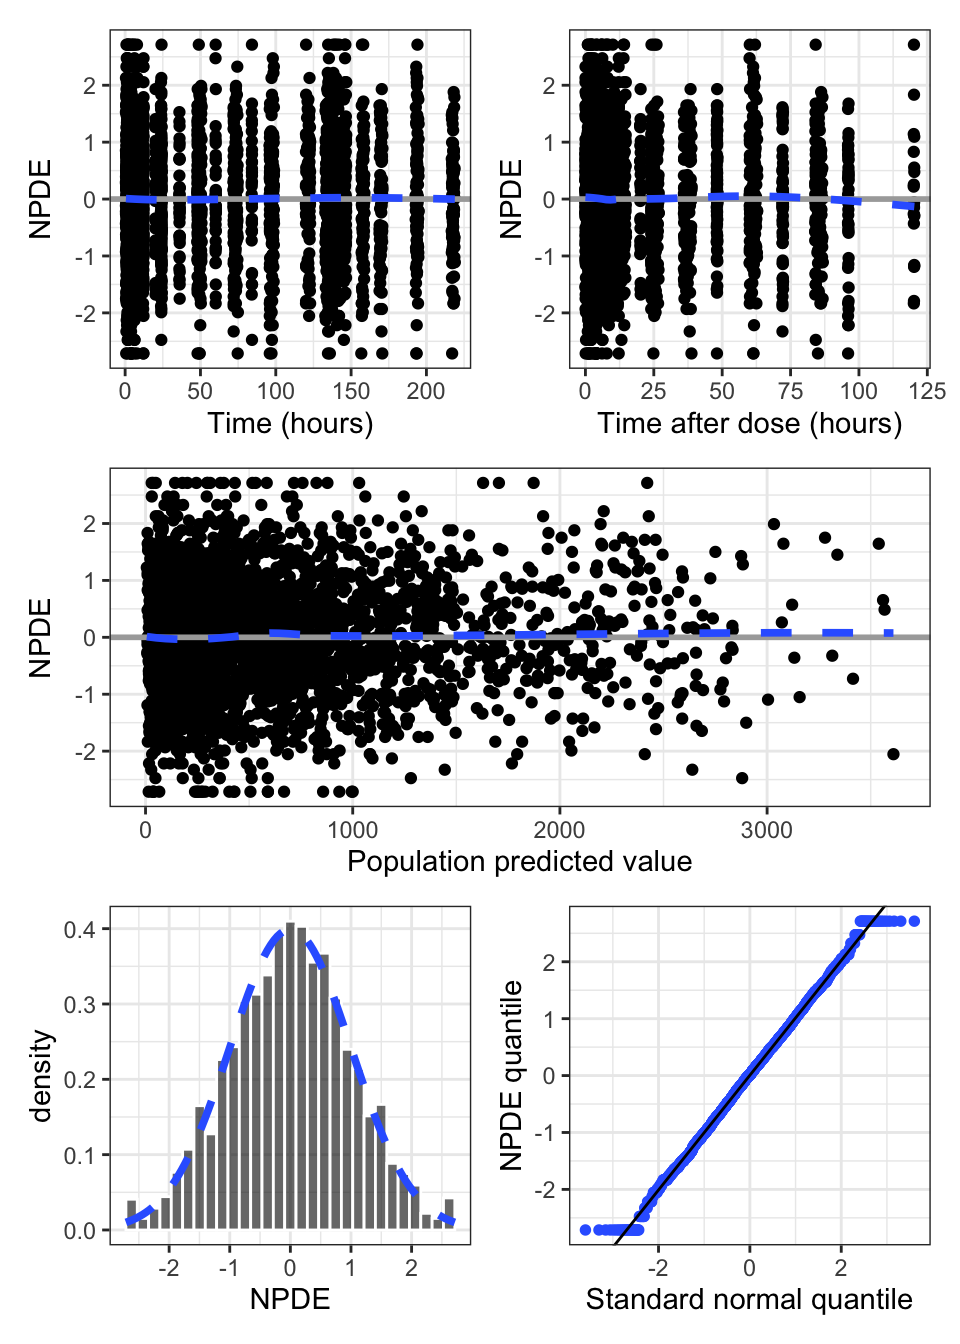
Displays of exploratory or diagnostic plots have several figures sharing a common theme arranged on a single page. These displays tend to have fixed composition and arrangement, with some customization allowed. If you want a totally custom display, it is best to create your own from base pmplots functions, arranging as you like with the patchwork package.
Displays can include ETA, NPDE or CWRES based plots.
Use npde_panel() to create a standardized panel of common NPDE-based diagnostics
data <- pmplots_data_obs()
npde_panel(data)
You can label the panels with the plot_annotation() function from the patchwork package
npde_panel(data) +
  plot_annotation(tag_levels = "A")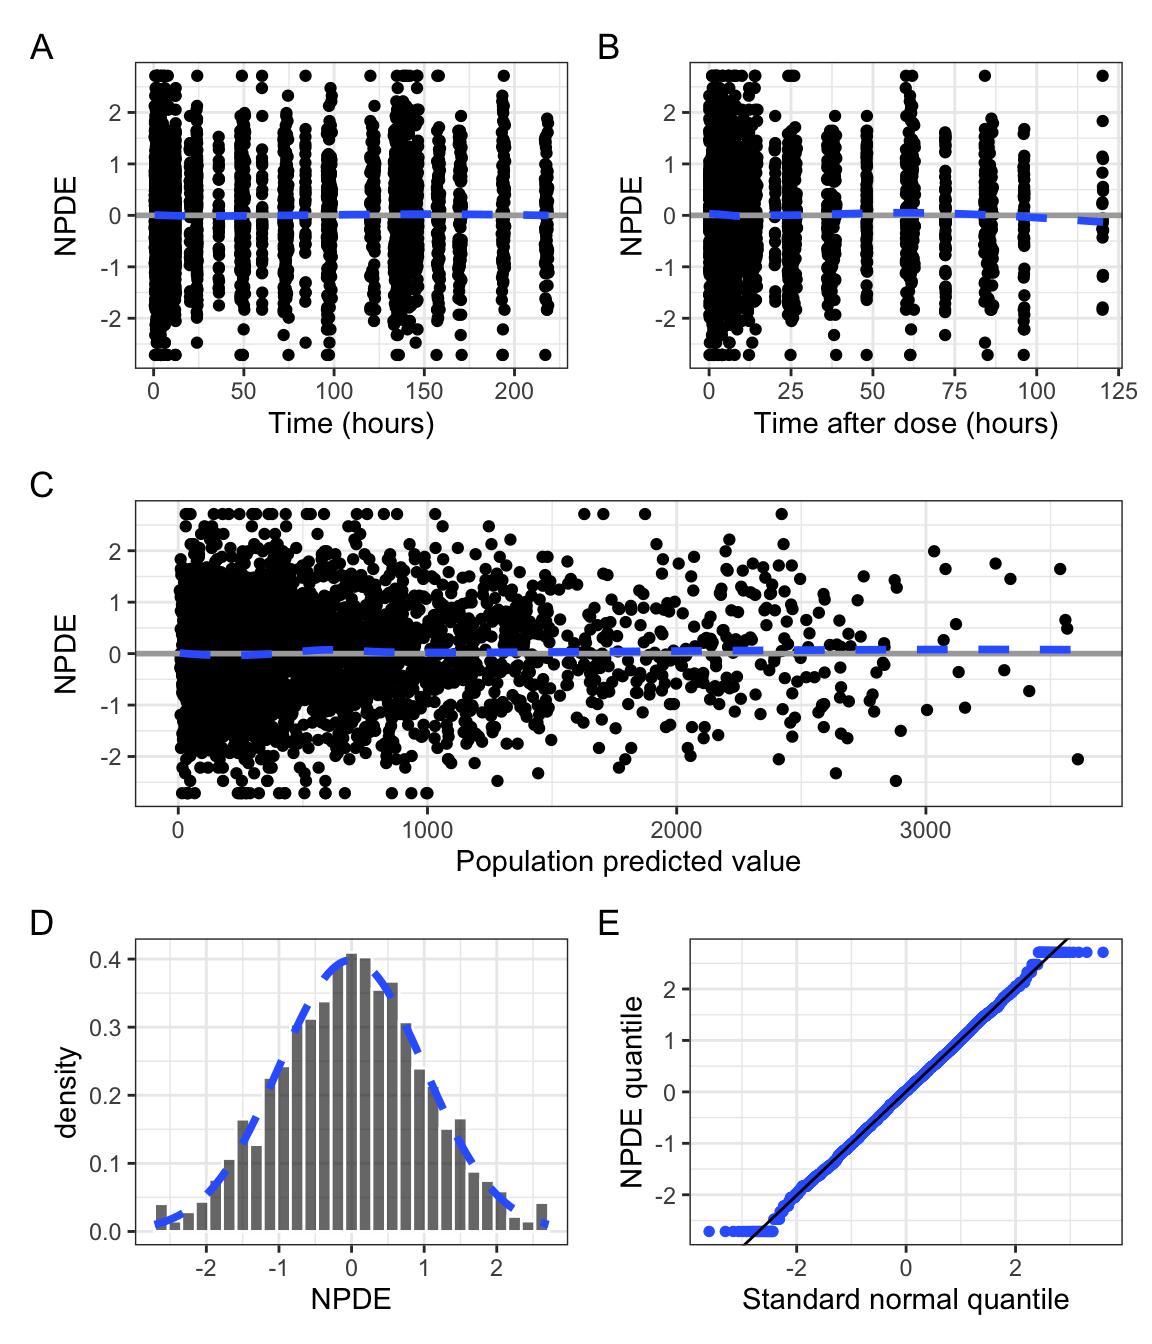
This display includes just a subset of the diagnostics which are scatter plots
npde_scatter(data)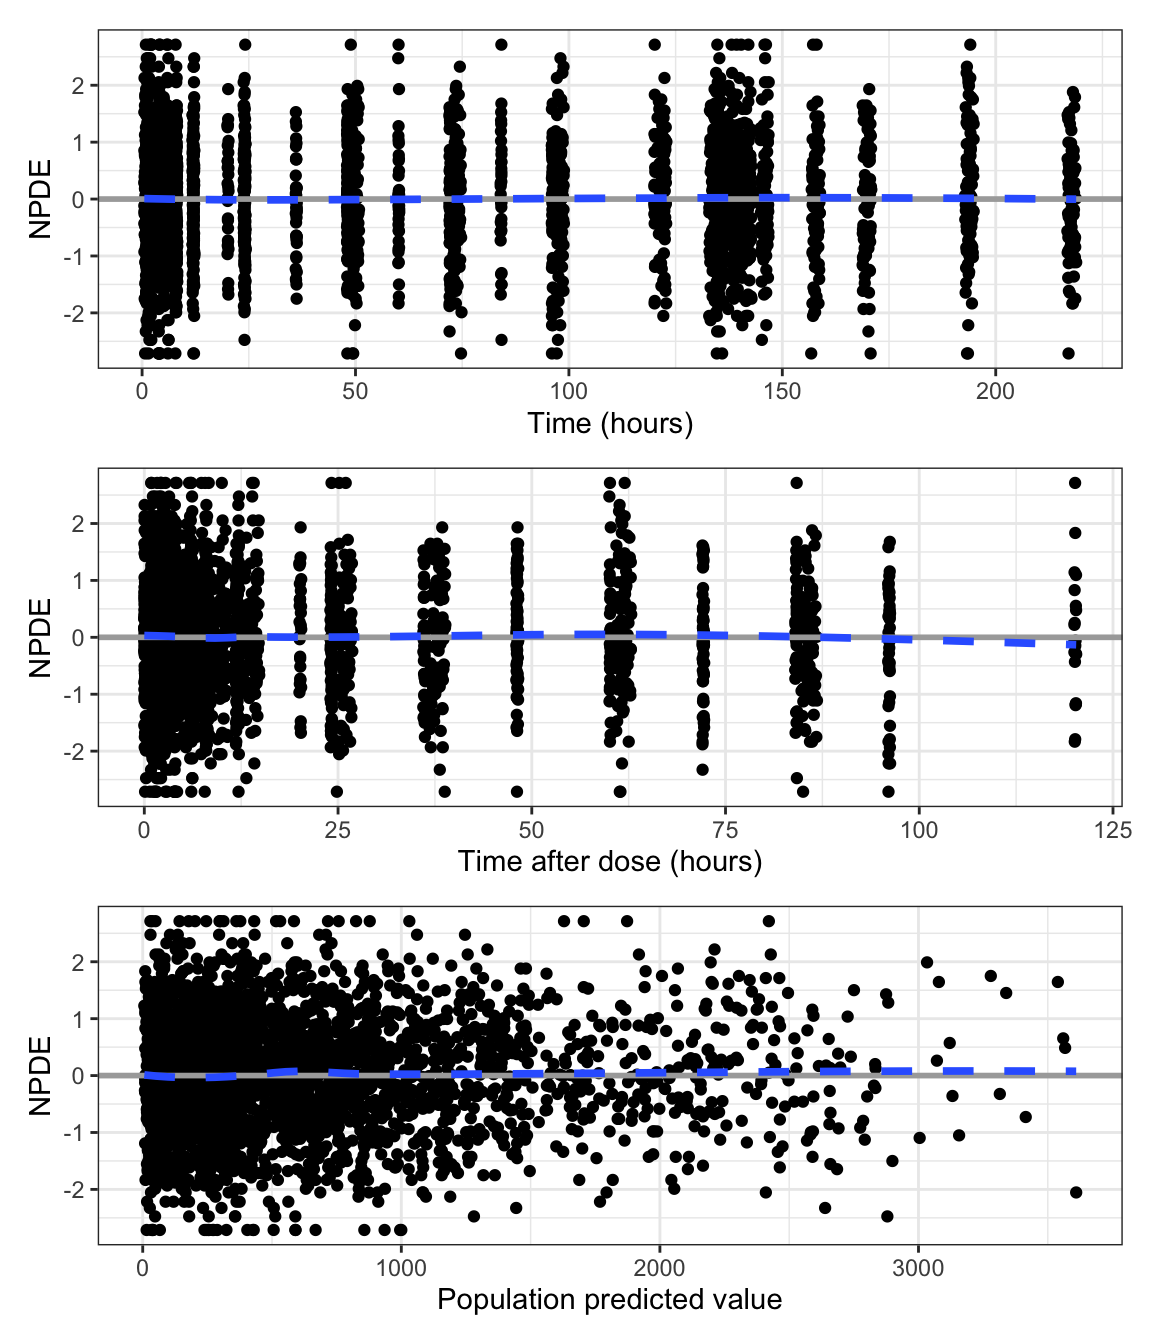
This display is the complement of the scatter plots
npde_hist_q(data)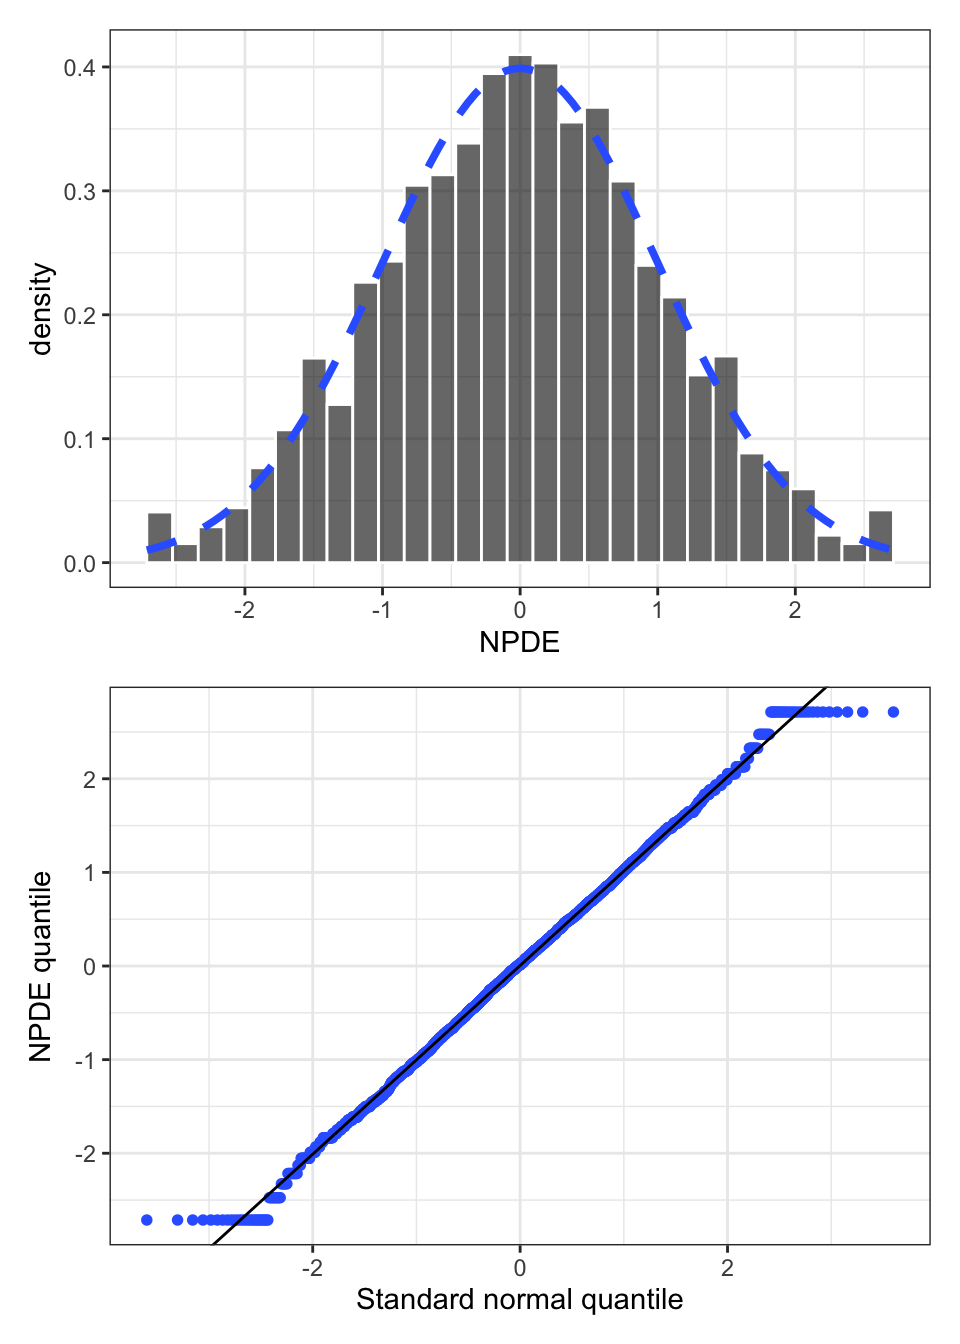
You can enter a mix of categorical and continuous covariates: here, WT and SCR are continuous covariates and RF and CPc are categorical
covs <- c(
  "WT  // Weight (kg)",
  "SCR // Serum creatinine (mg/dL)",
  "RF  // Renal group",
  "CPc // Child-Pugh"
)
npde_covariate(data, covs)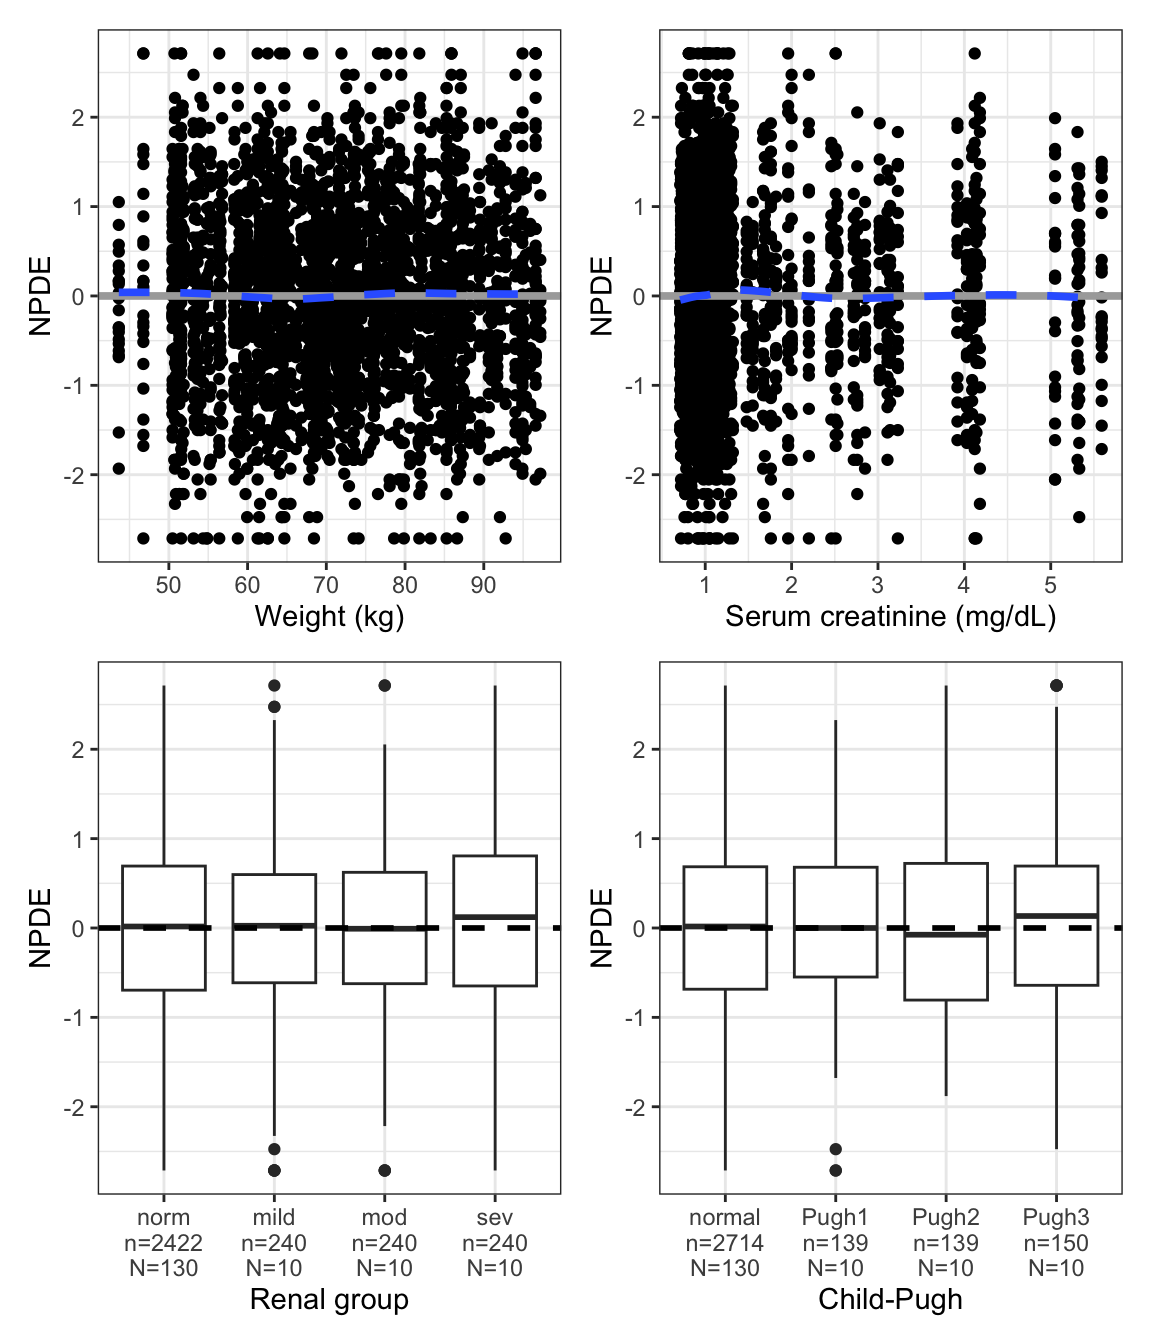
There are a equivalent set of displays which show CWRES rather than NPDE
cwres_panel(data) 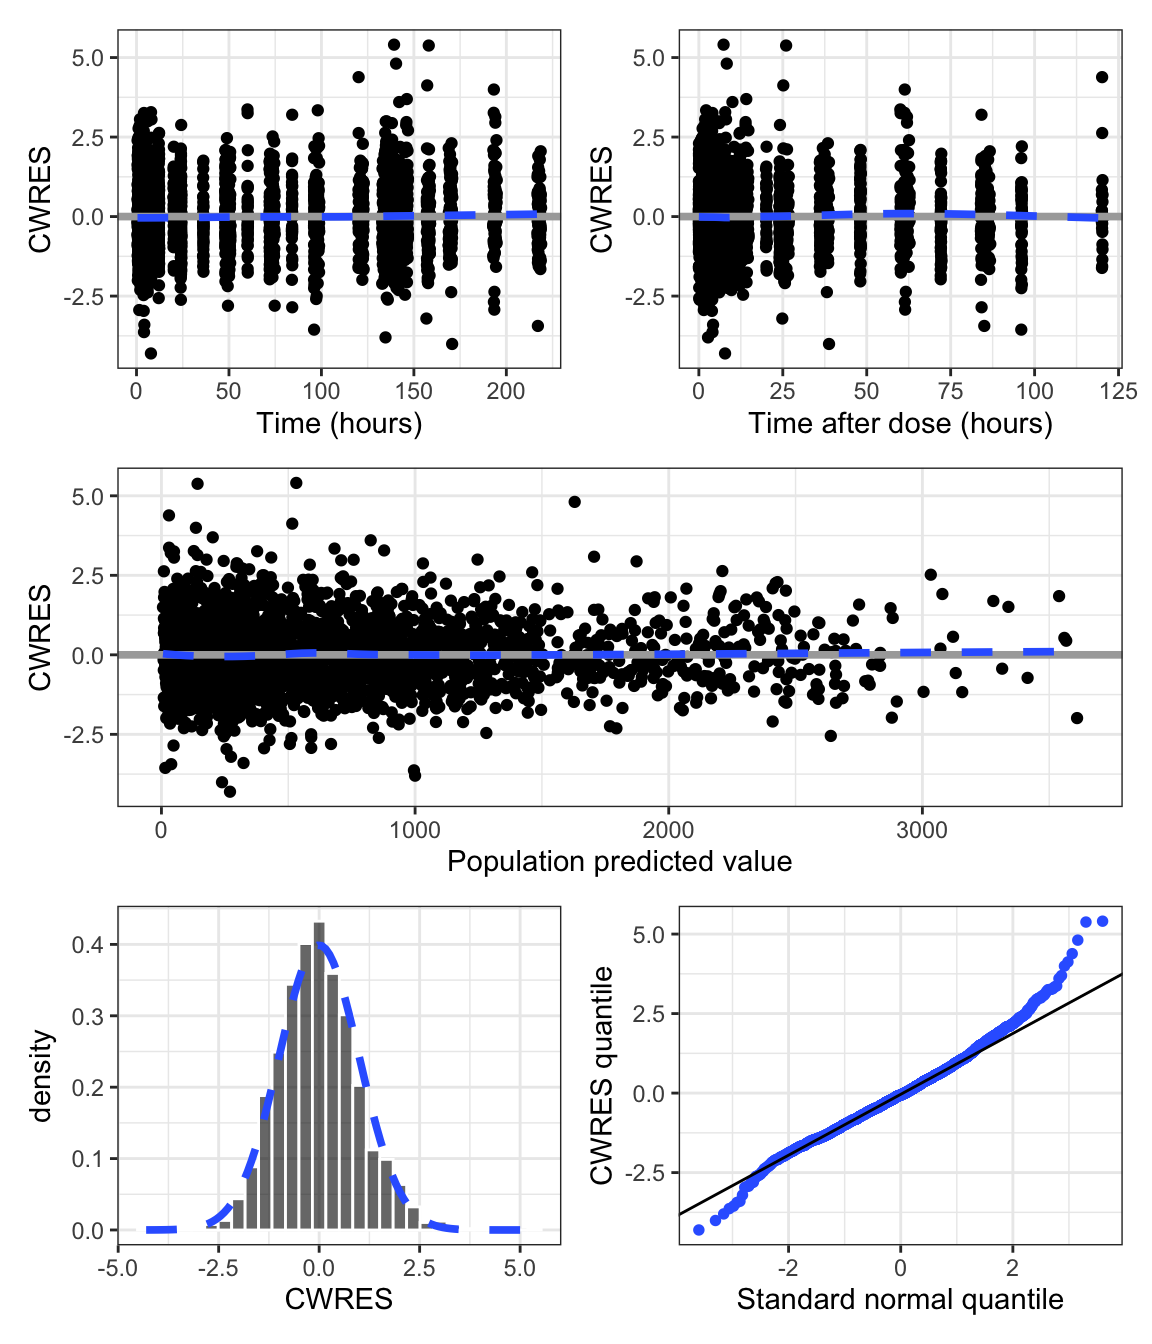
cwres_scatter(data)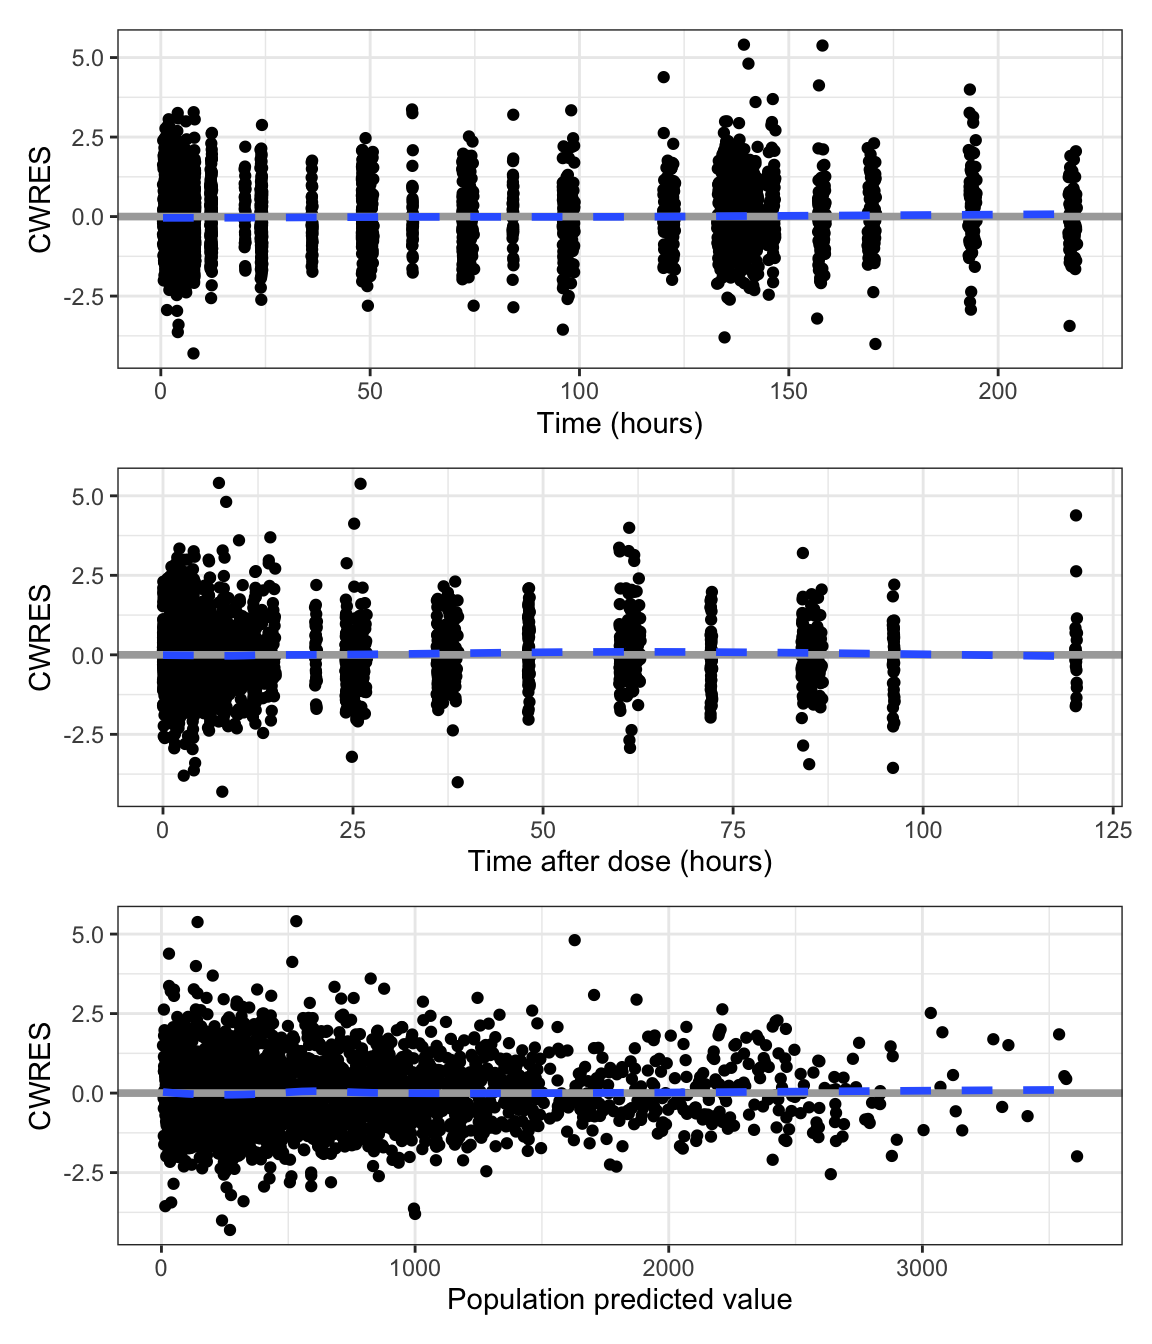
cwres_hist_q(data)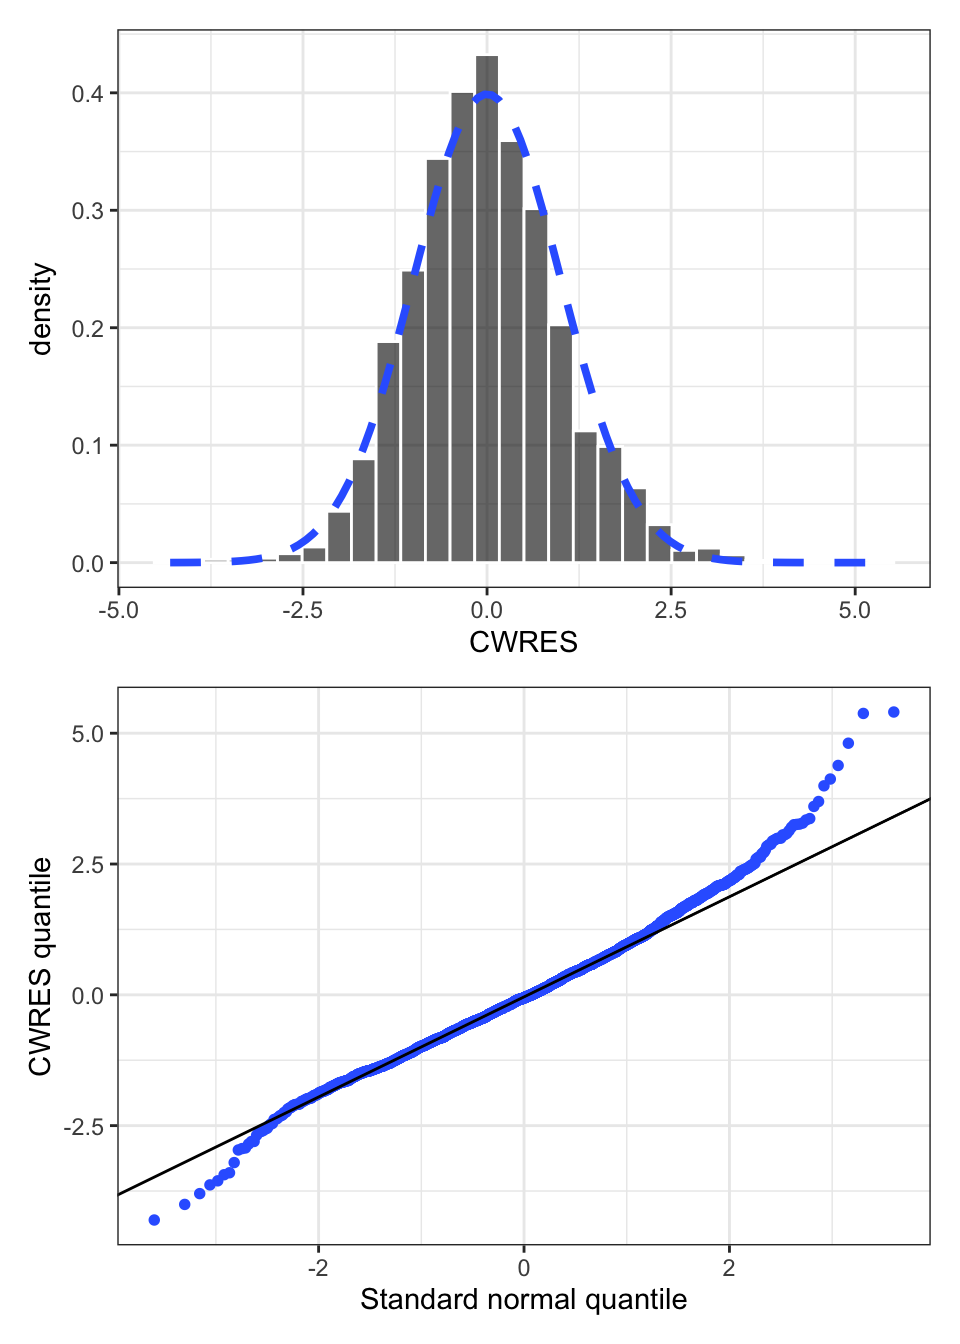
covs <- c(
  "WT  // Weight (kg)",
  "SCR // Serum creatinine (mg/dL)",
  "RF  // Renal group",
  "CPc // Child-Pugh"
)
cwres_covariate(data, covs)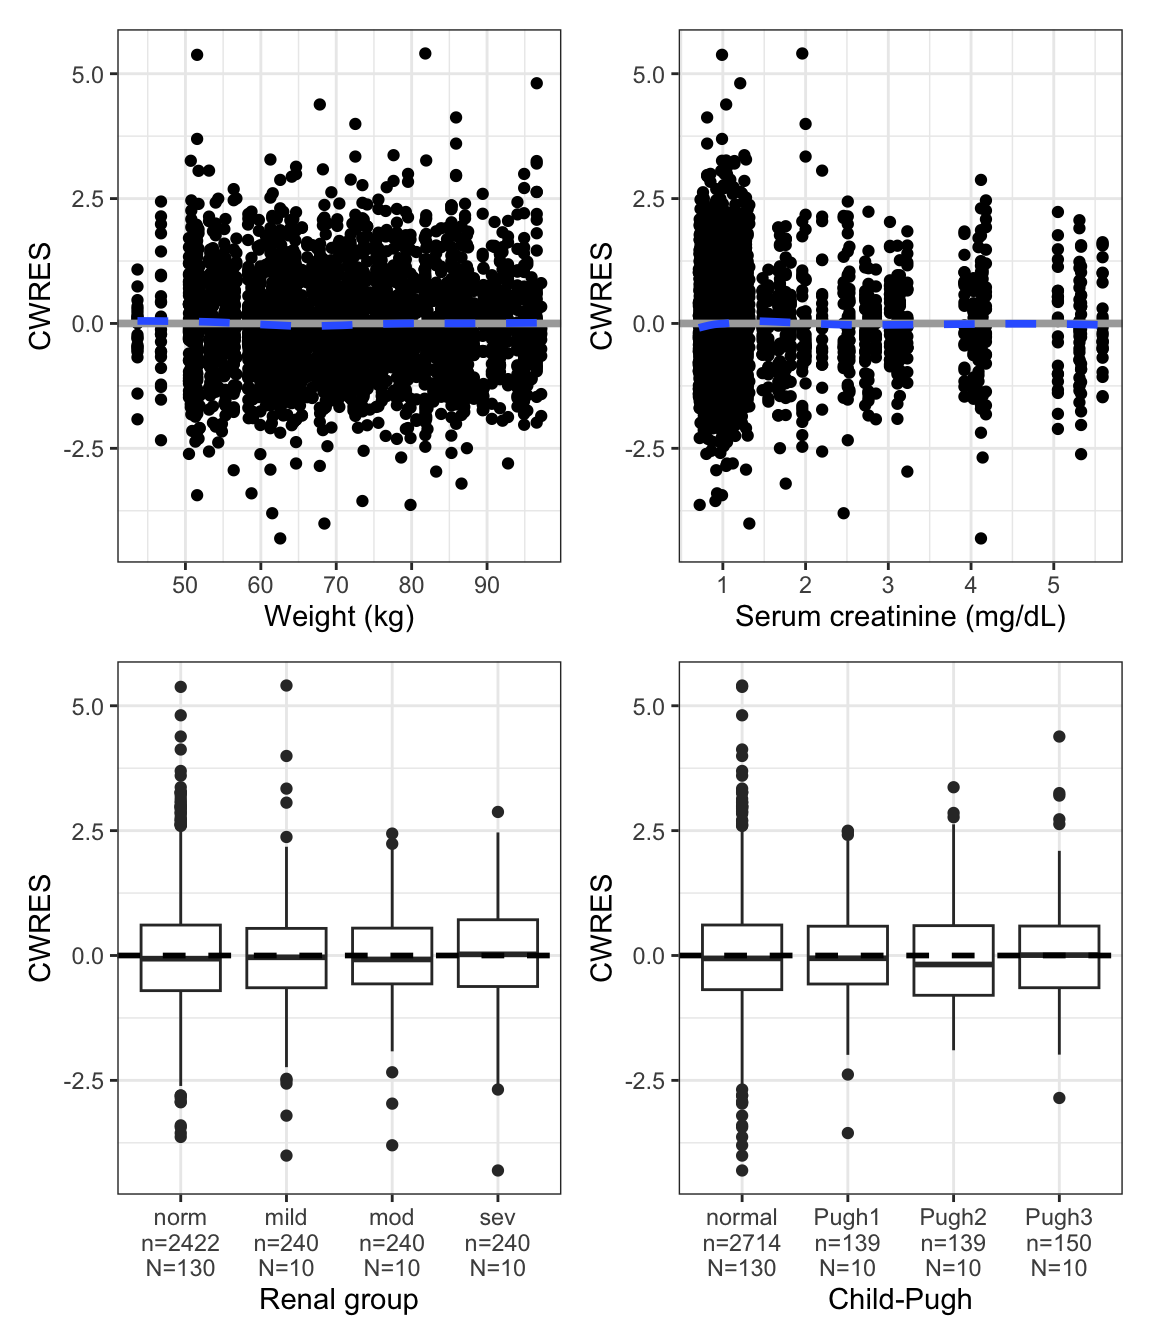
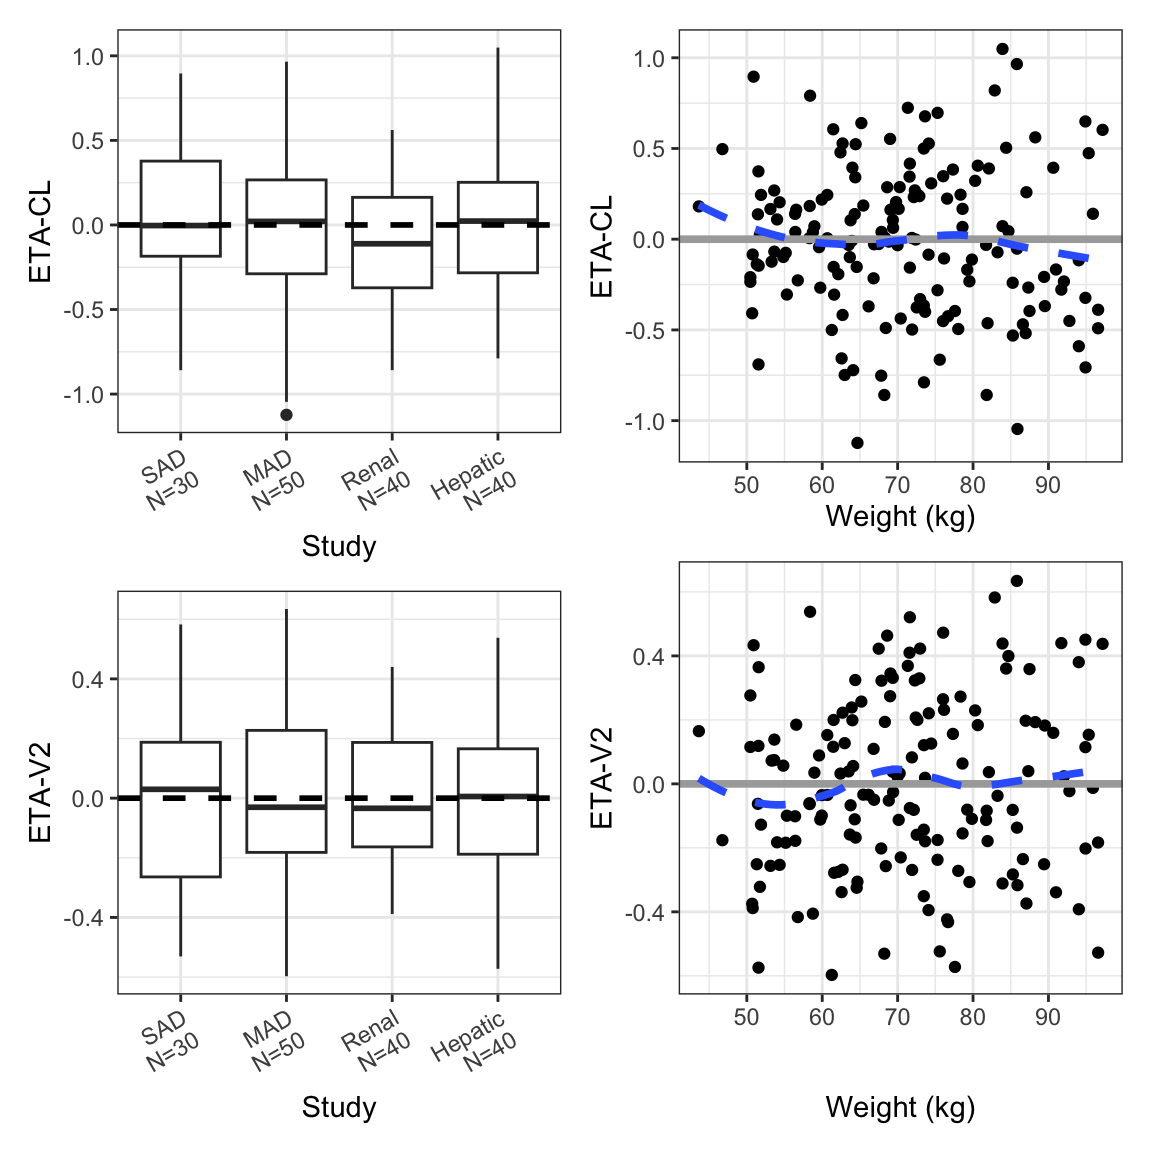
These displays are created with eta_covariate(). Since there are typically several ETAs to look at, this function returns a list of arranged plots
id <- pmplots_data_id()etas <- eta_col_labs(CL, V2)
etas ETA-CL ETA-V2
"ETA1//ETA-CL" "ETA2//ETA-V2" For ETA diagnostics, we can plot versus a mix of categorical and continuous covariates
covs <- c(
  "WT     // Weight (kg)",
  "AAG    // AAG (mg/dL)",
  "STUDYc // Study",
  "RF     // Renal function"
)

cov <- eta_covariate(id, x = covs , y = etas, byrow = FALSE)
By default, the plots are collected by the ETA
names(cov)[1] "ETA1" "ETA2"cov$ETA1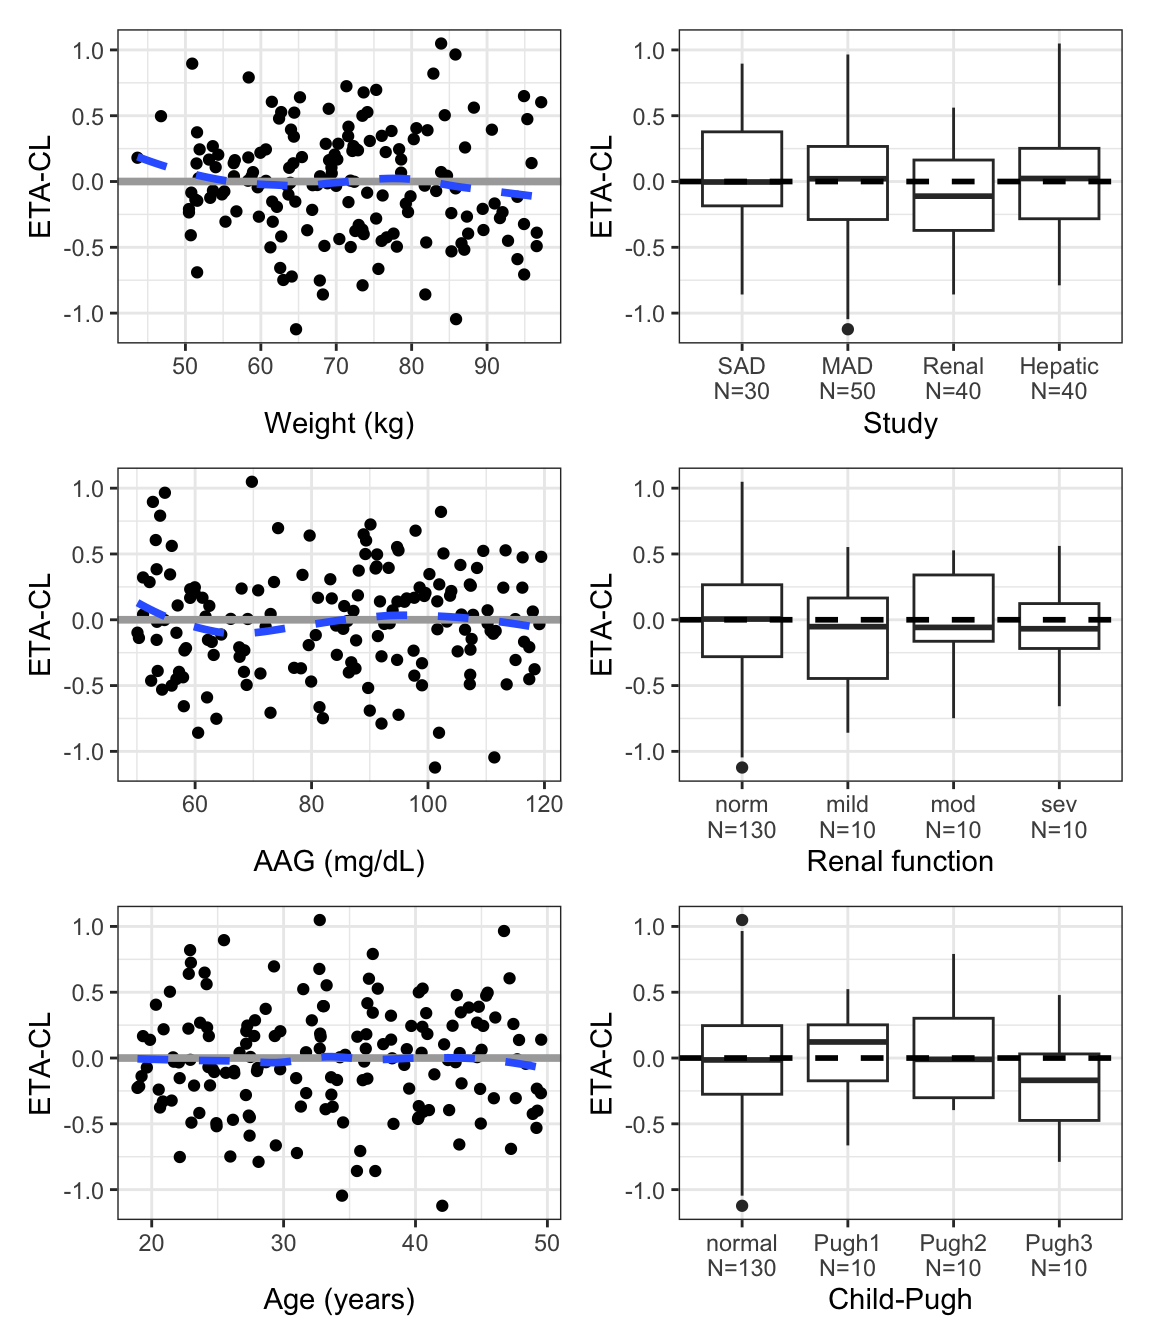
Use the transpose argument to collect by the covariate
cov <- eta_covariate(id, covs, etas, transpose = TRUE, ncol = 1)

names(cov)
[1] "WT" "AAG" "STUDYc" "RF" cov$WT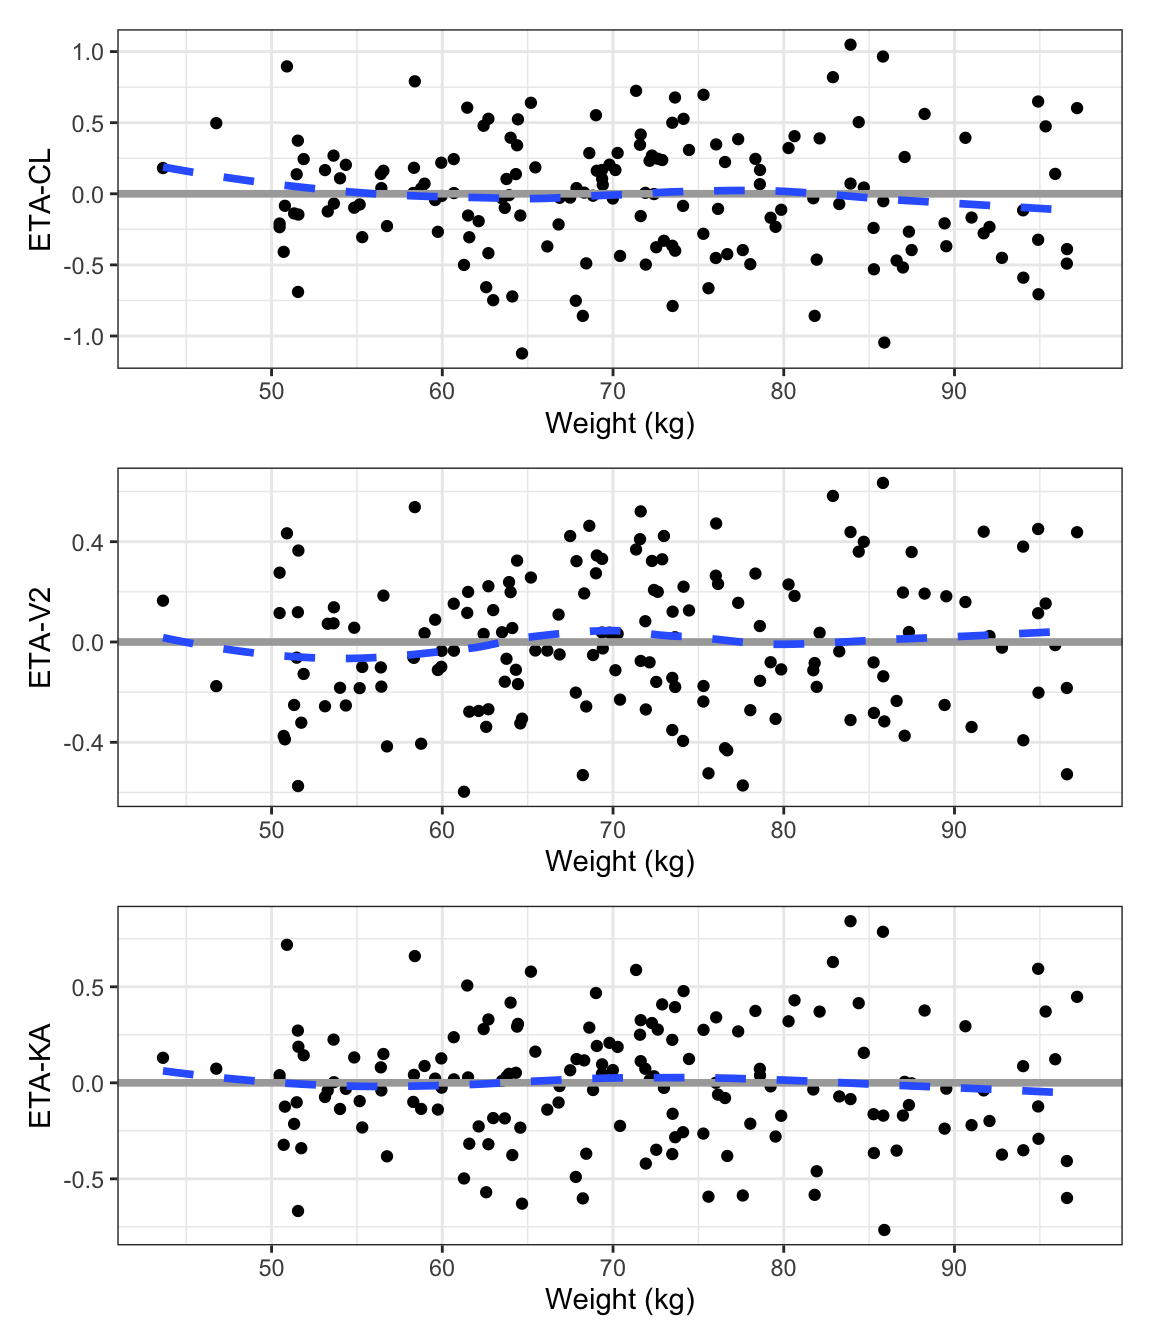
You can request one of the panel displays as a list of the component plots. In general, you can call the function with _list suffix. For example, x here is a named list of plots
x <- npde_panel_list(data)
names(x)
[1] "time" "tad" "hist" "q" "pred"x$tad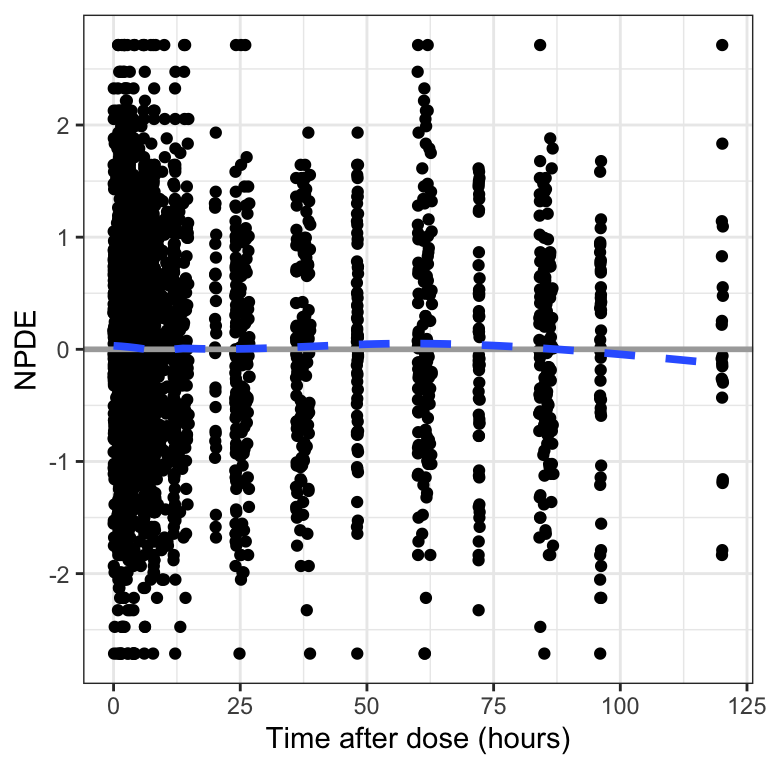
Similar for the covariate plots, but the result will be a list of lists
x <- eta_covariate_list(id, x = covs , y = etas)
names(x)
[1] "ETA1" "ETA2"names(x$ETA1)[1] "WT" "AAG" "STUDYc" "RF" x$ETA1$AAG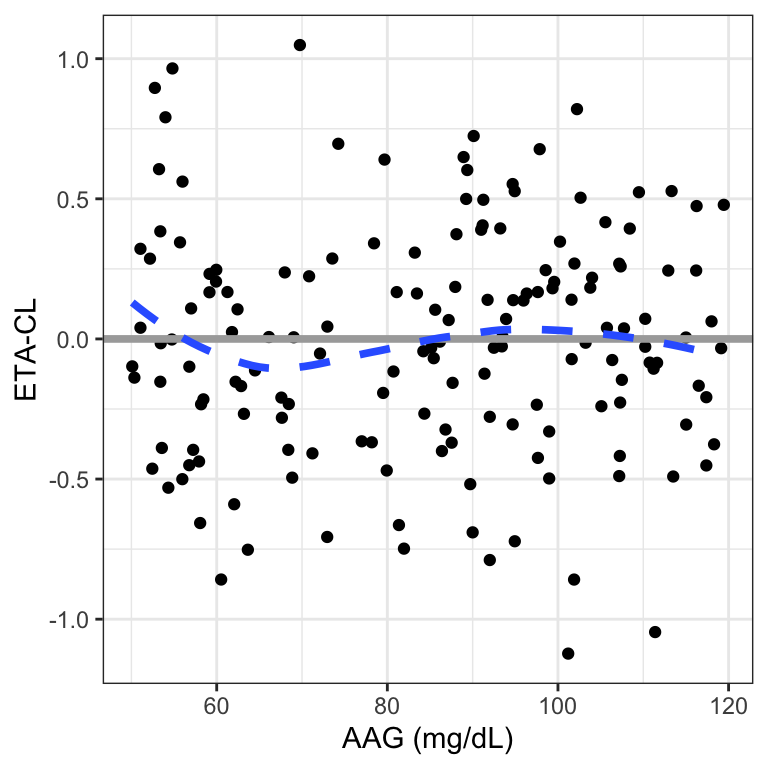
Plots can be arrranged in a grid with pm_grid()
x <- cwres_panel_list(data)
pm_grid(x, ncol = 2)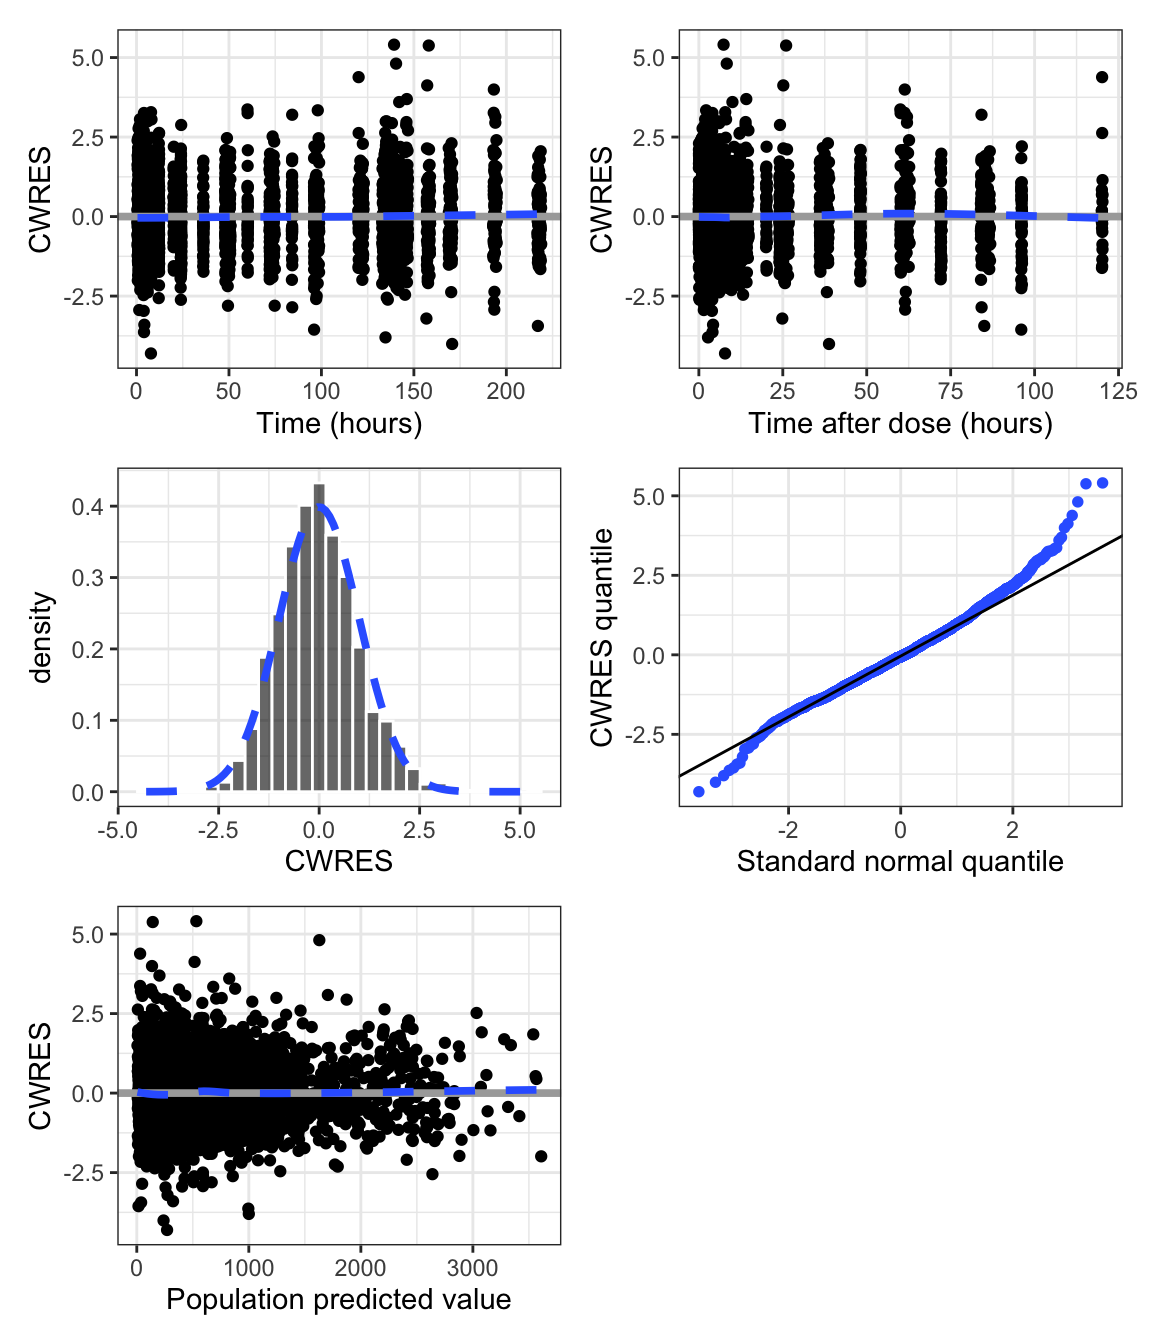
Or, use pm_with() to arrange them using patchwork syntax
library(patchwork)

names(x)
[1] "time" "tad" "hist" "q" "pred"pm_with(x, time / (hist+q) / (tad+pred)) 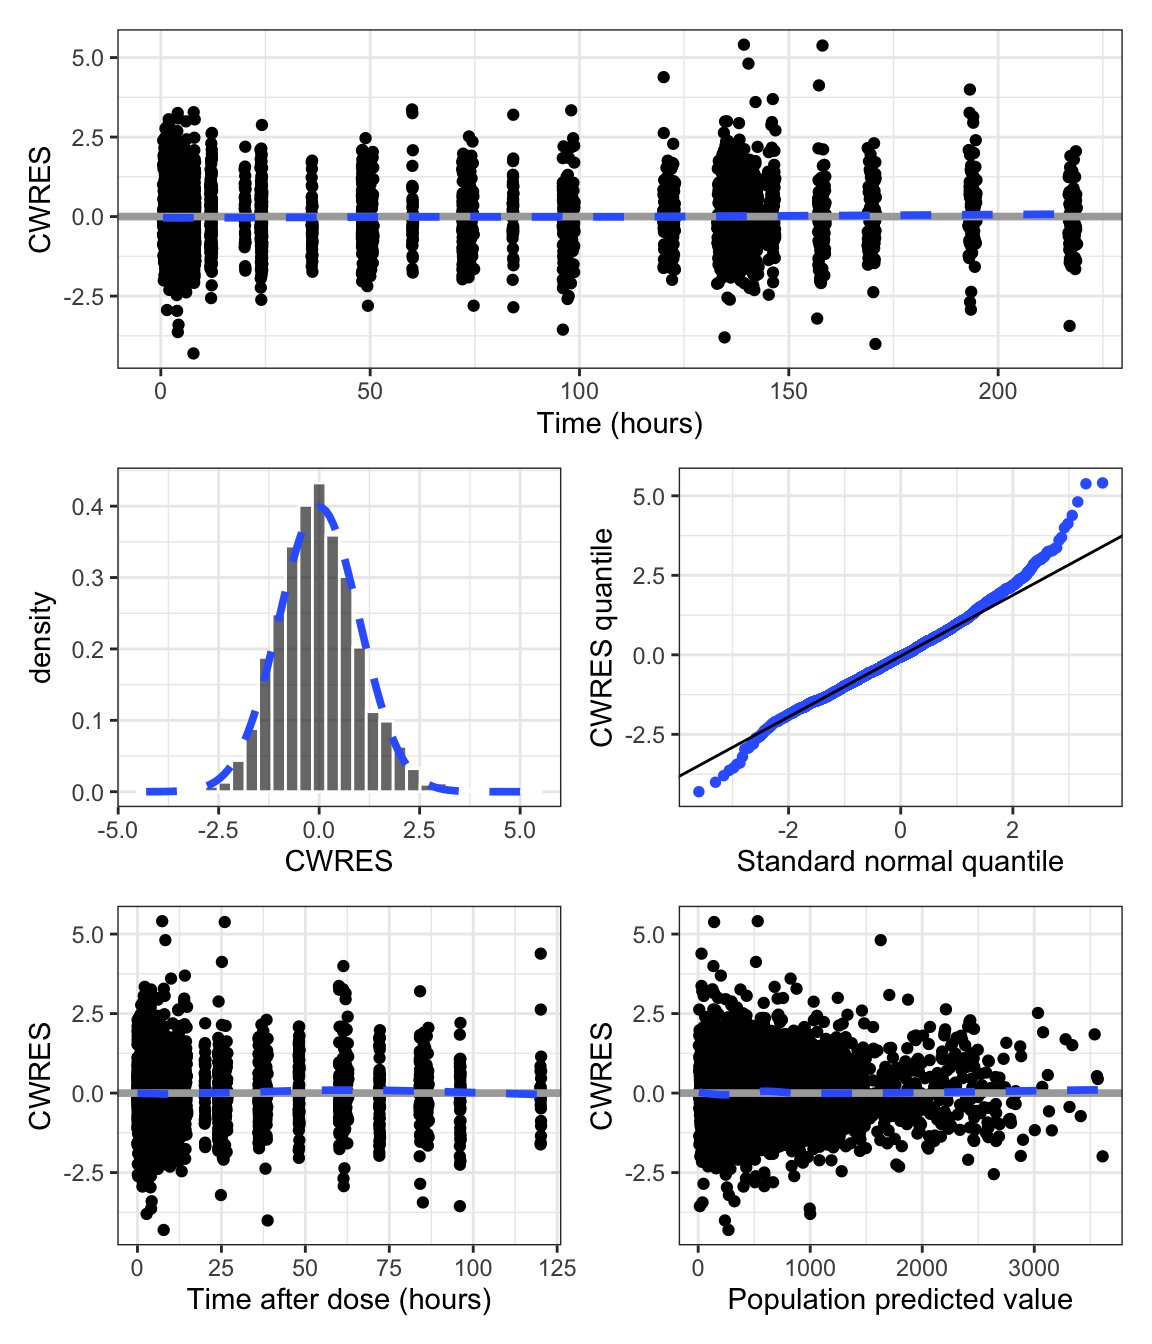
Use rot_xy() to rotate axis tick marks on a plot. There are methods for gg objects, patchwork objects, and lists of these objects.
x <- eta_covariate(id, x = covs , y = etas, transpose = TRUE,
                   ncol = 1)

x <- rot_xy(x, at = c("STUDYc", "RF"))

pm_with(x, STUDYc | WT)