dd1 <- filter(df, ID <= 9)This function will split your dataset up in “chunks” according to the columns named in facets. Pass the number of id_per_plot. The return is a list of plots covering all unique values in facets.
In this example, we’ll just plot 9 subjects in a single plot
Please see the ?dv_pred_ipred help file as there are many arguments which allow you to customize the output
dv_pred_ipred(
  dd1,
  facets = "ID",
  id_per_plot = 9
)
$`1`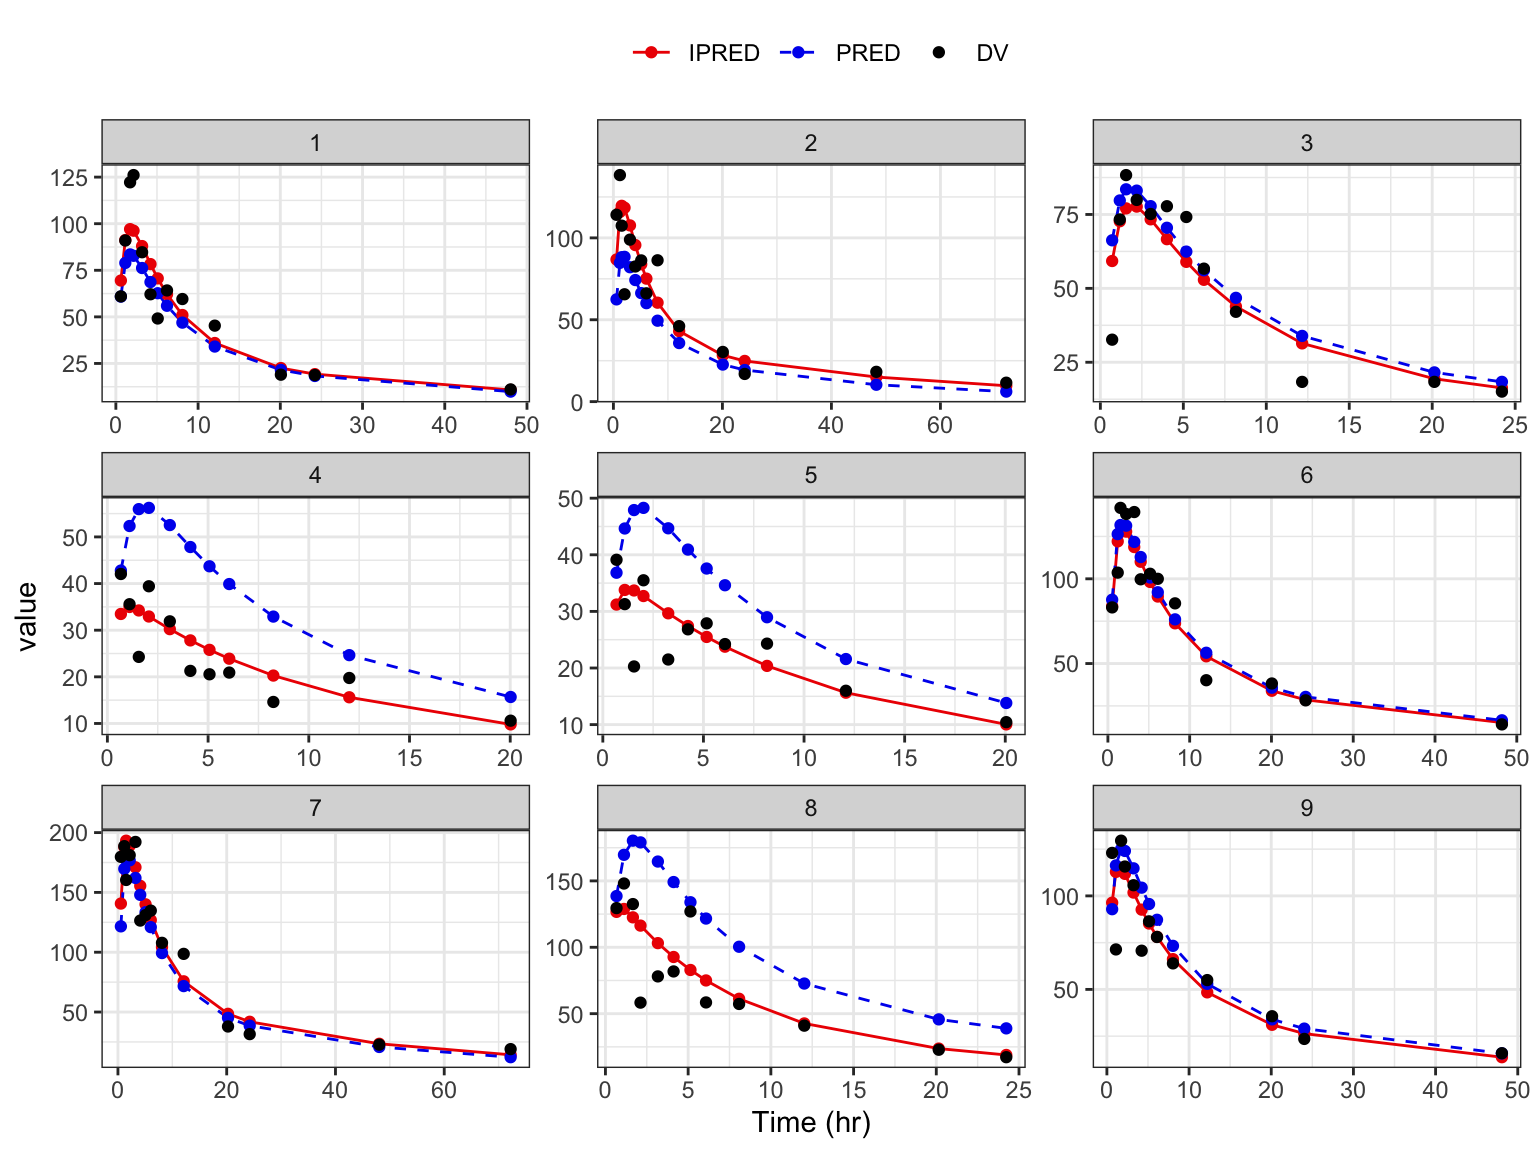
Some arguments to note
log_y- log transformed y-axisangle- for rotatingx-axistick labelsxlab-x-axistitleylab-y-axistitlenrow- for arranging facets on a pagencol- for arranging facets on a pagefun- a function which modifies every plot in the output list
There are also a whole series of arguments for configuring the points and lines on the plot for DV, PRED and IPRED.