.yname[1] "MRG1557 (ng/mL)"We define a variable that can be passed as yname, or the name of DV
.yname[1] "MRG1557 (ng/mL)"[dv_pred]dv_pred(df, yname = .yname)
By default, pmplots forces the x- and y- scales to have the same limits so you get a square plot. You can prevent this behavior with
dv_pred(df, scales = "free")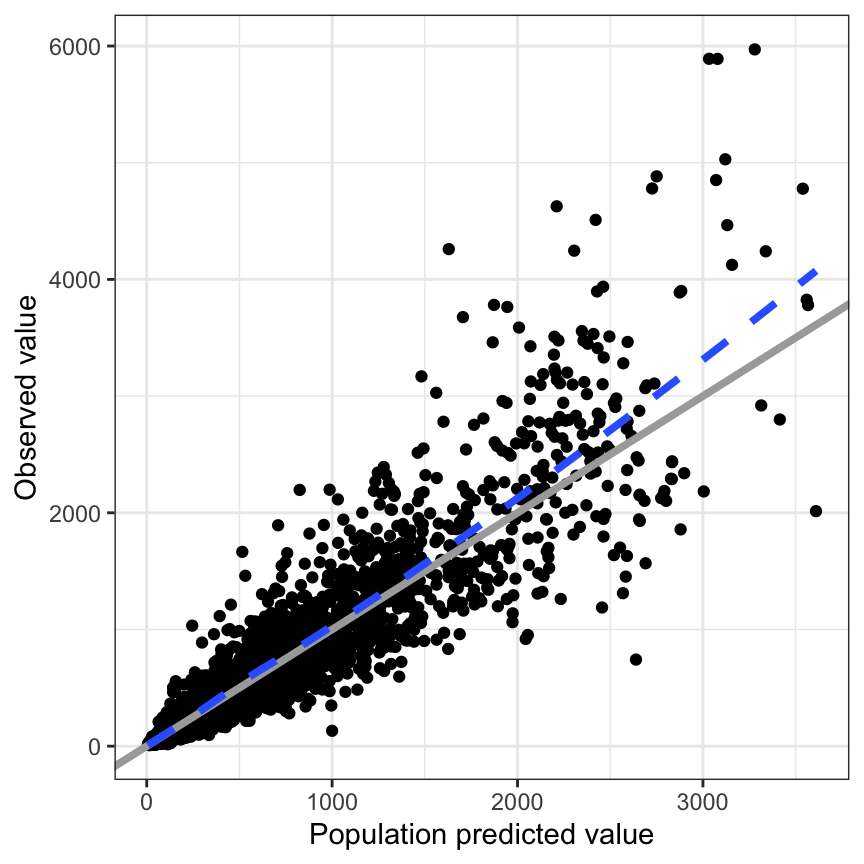
If you are faceting, you’ll have to pass scales="free" to both dv_pred() and facet_wrap()
dv_pred(df, scales = "free") + facet_wrap(~RF, scales = "free")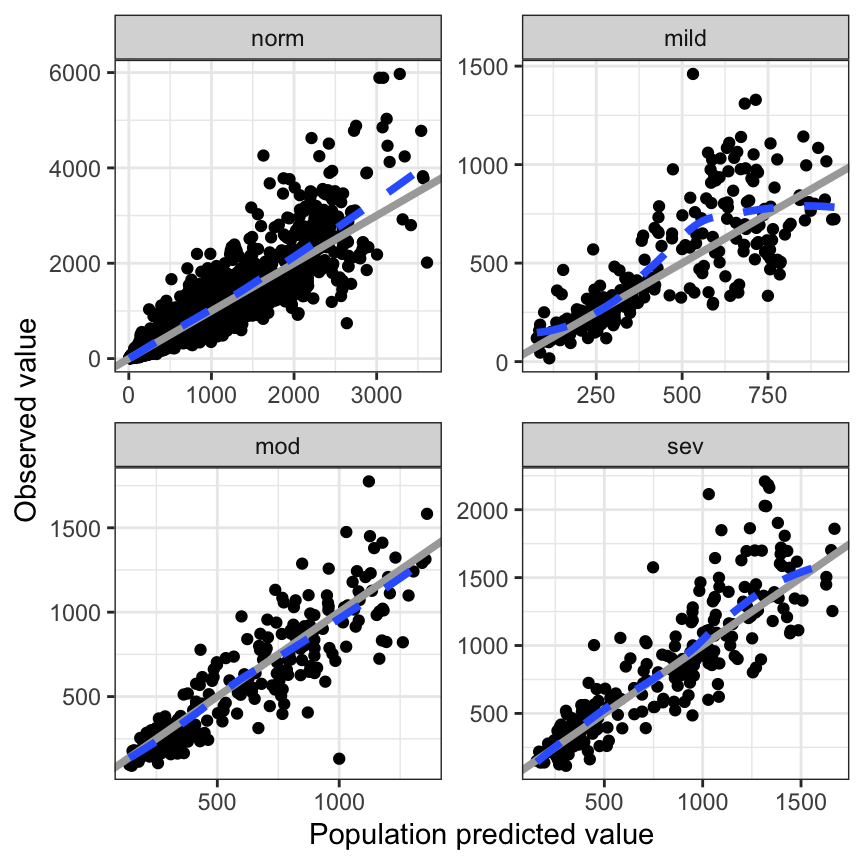
dv_pred(df, loglog=TRUE, yname = .yname)
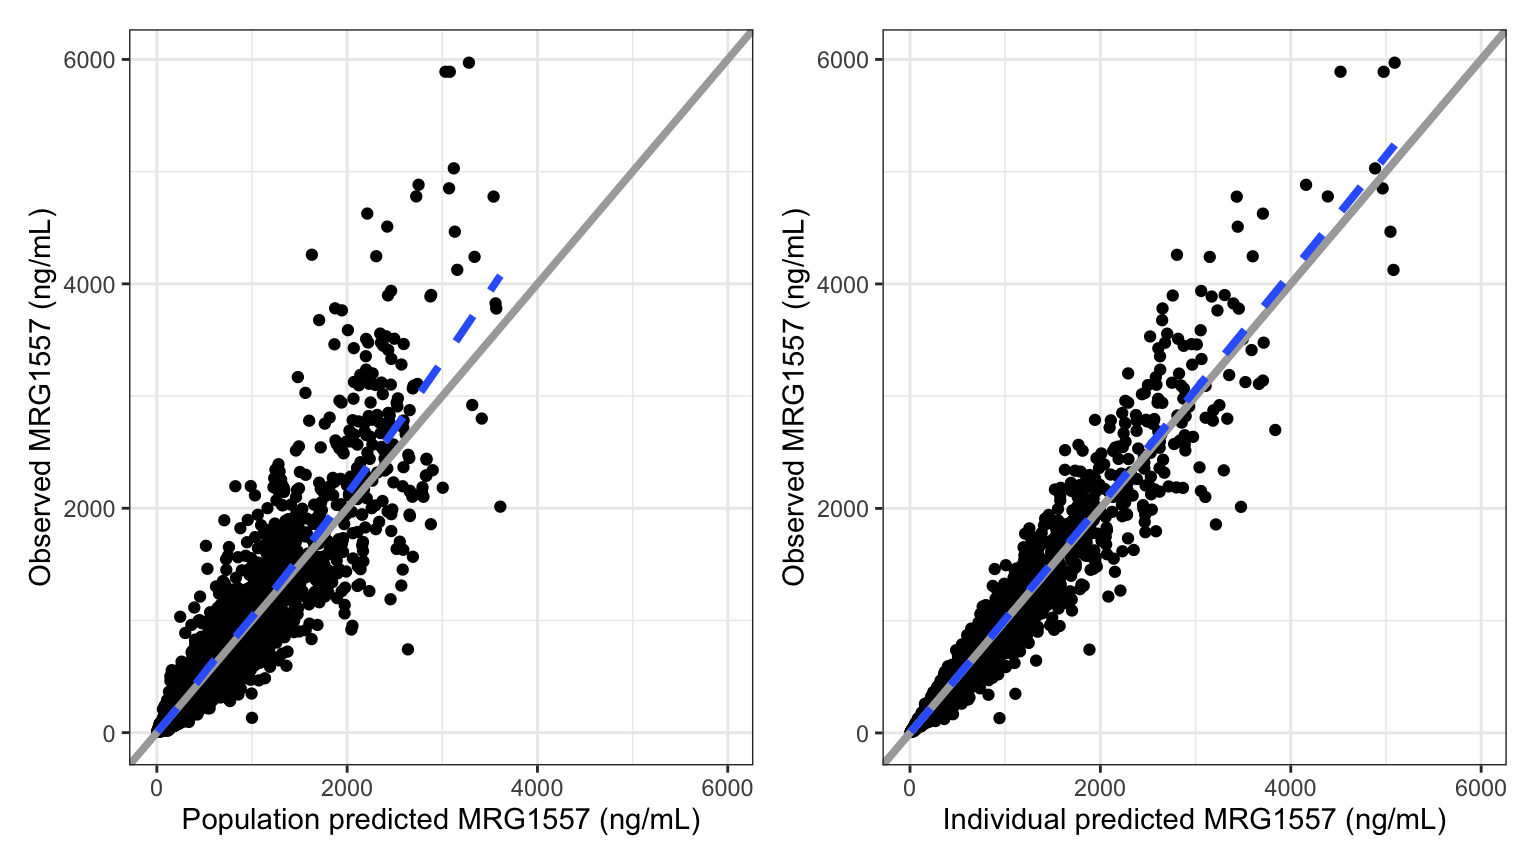
[dv_ipred]dv_ipred(df, yname = .yname)
dv_ipred(df, loglog = TRUE, yname = .yname)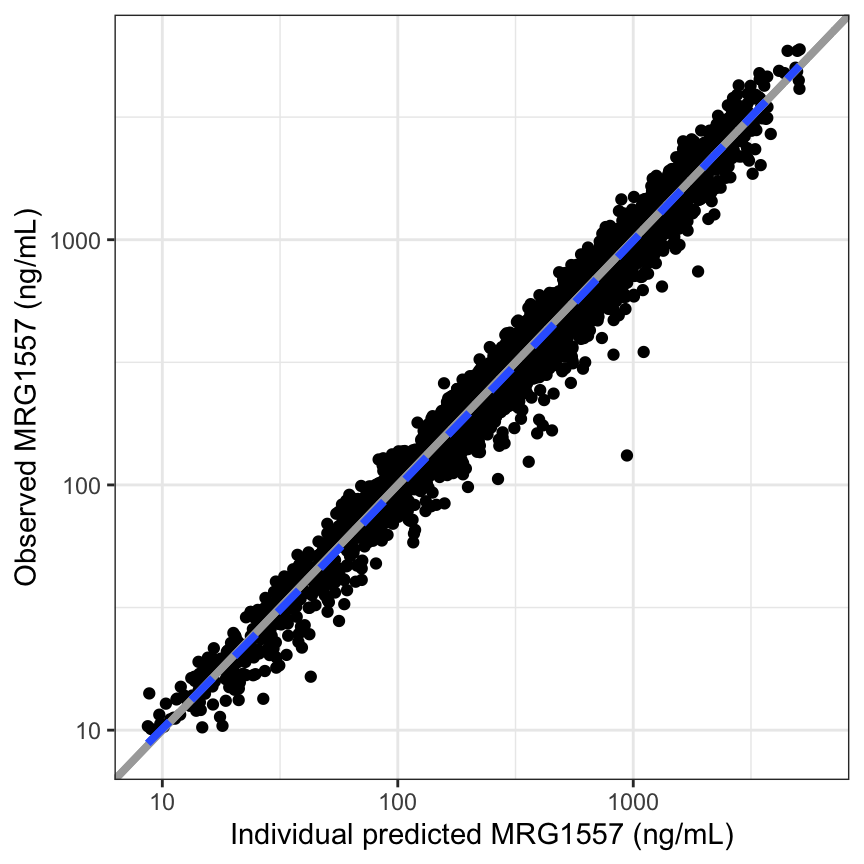
[dv_preds]dv_preds(df, yname = .yname) %>% pm_grid(ncol = 2)