cols <- c("WT//Weight", "ALB//Albumin", "SCR//Serum creat")
pairs_plot(id, cols)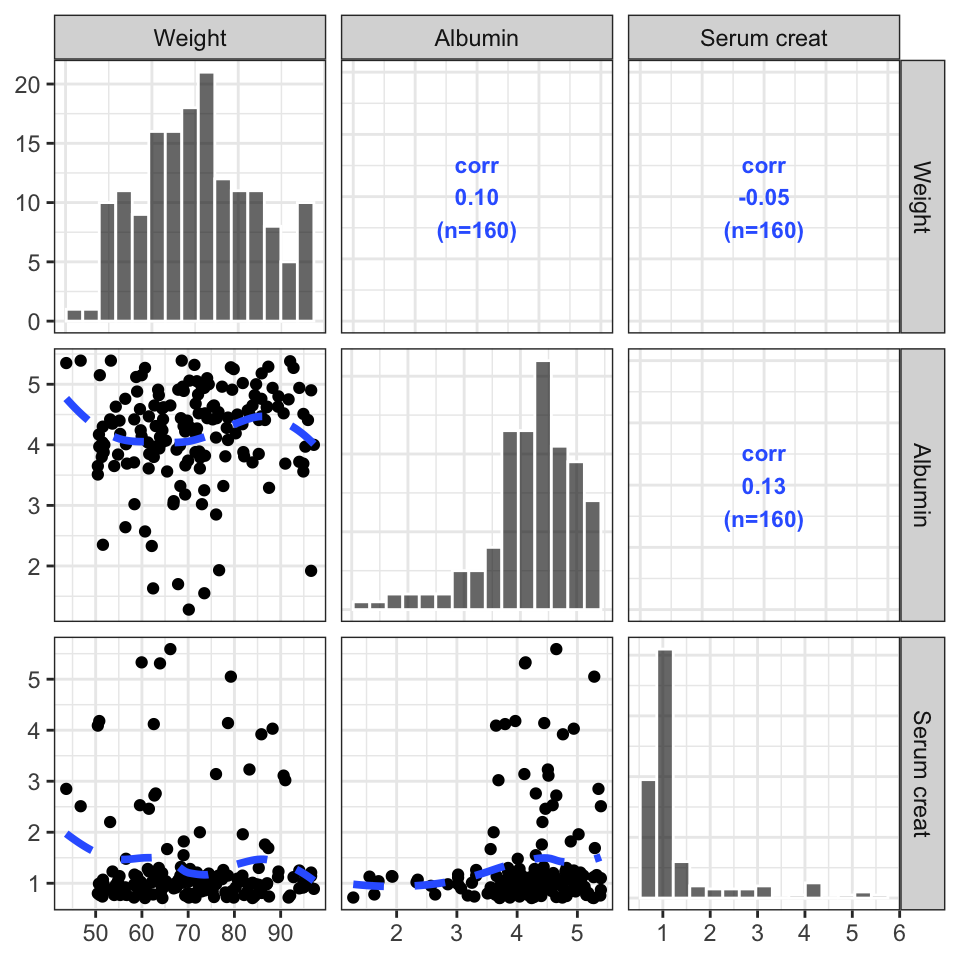
This is a simple wrapper around GGally::ggpairs with some customizations that have been developed internally at MetrumRG over the years.
cols <- c("WT//Weight", "ALB//Albumin", "SCR//Serum creat")
pairs_plot(id, cols)
One customization we’ve added is the annotation on the upper triangle, which is the complete.obs correlation between x and y along with the number of observations.
There is also a function called eta_pairs() that is identical to the pairs_plot() function. This might be helpful to remember the function name but there is no difference in functionality between eta_pairs() and pairs_plot().
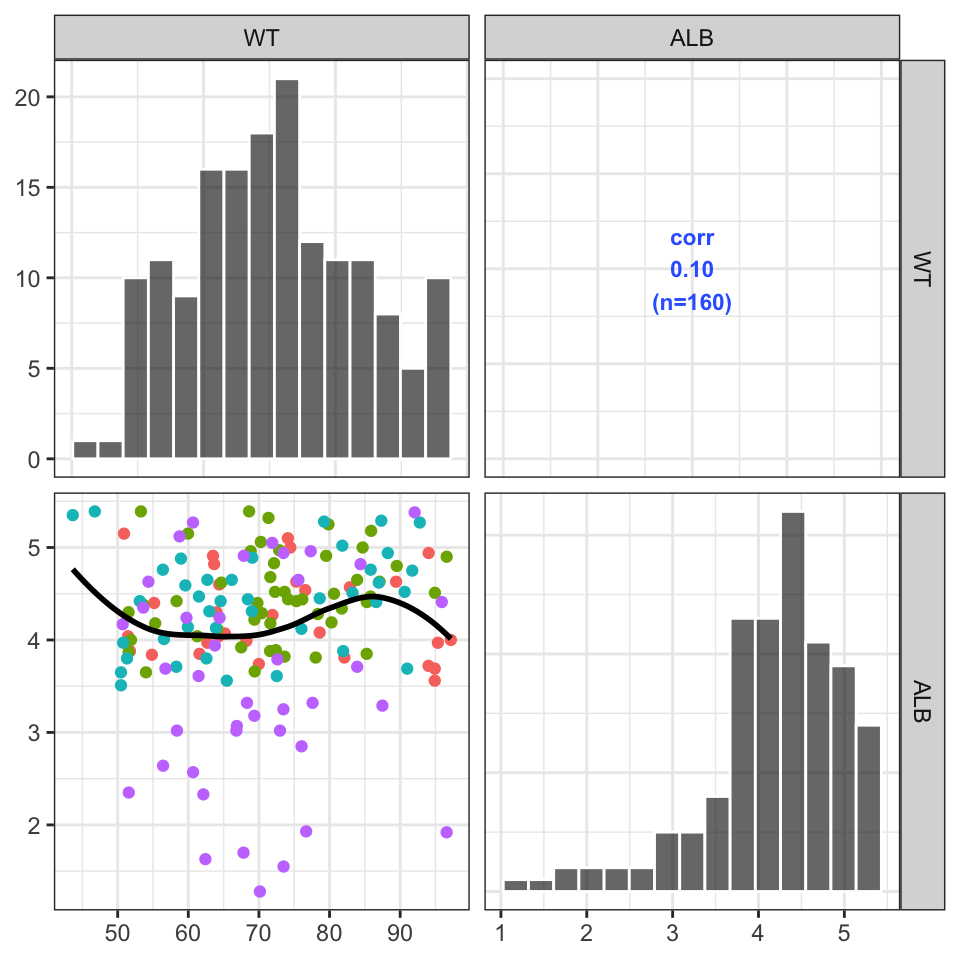
Pass a function that customizes the scatter plots on the lower triangle. This function should accept a gg object and add a geom to it
my_lower <- function(p) {
  p + geom_point(aes(color = STUDYc)) +
    geom_smooth(se = FALSE, color = "black")
}pairs_plot(id, c("WT", "ALB"), lower_plot = my_lower)