pm_scatter(
  df,
  x = "TIME",
  y = c("RES", "WRES", "CWRES")
)
[[1]]
[[2]]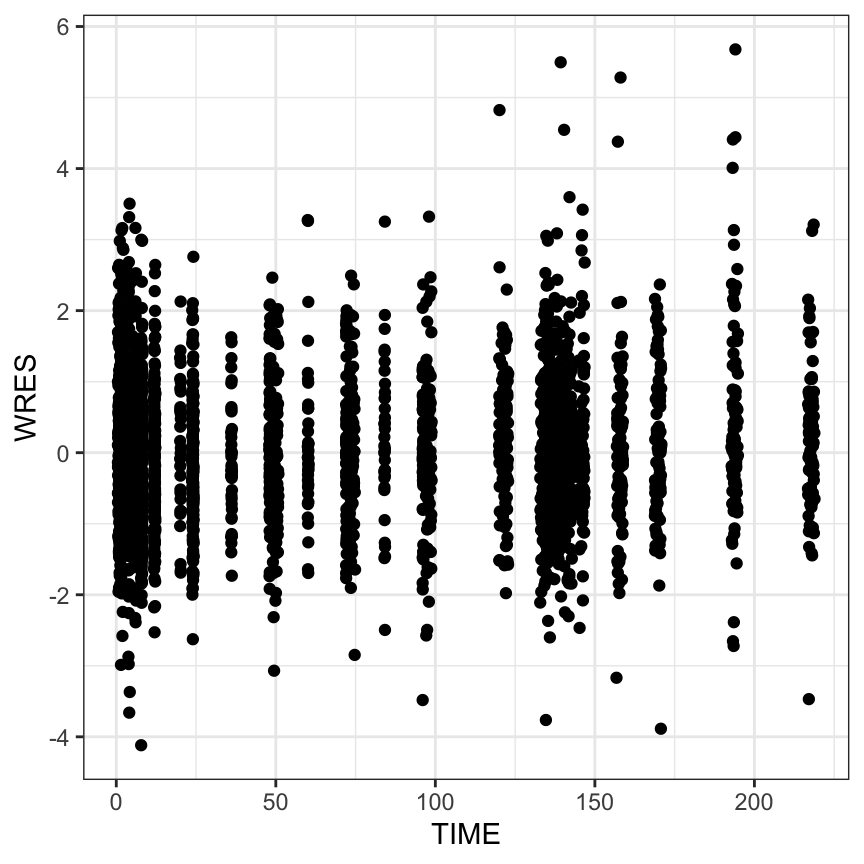
[[3]]
When we say “vectorized”, it means that you can pass in a vector of x or y and you’ll get back a list of plots
pm_scatter(
df,
x = "TIME",
y = c("RES", "WRES", "CWRES")
)[[1]]
[[2]]
[[3]]
Note that we typically use pm_grid() to arrange the plots
pm_scatter(
  df,
  x = "TIME",
  y = c("RES", "WRES", "CWRES")
) %>% pm_grid(ncol = 2)
pm_grid() uses the excellent patchwork package to arrange a list of plots into some sort of grid.